Chapter 4 Toolbox
This chapter describes the FluvialGeomorph toolbox structure and the products it creates. This chapter begins with a description of the platforms used, the structure of the FluvialGeomorph ArcGIS toolbox and concludes with a description of the products created.
4.1 Platforms
The FluvialGeomorph toolbox uses ESRI and open source software to combine several platforms, each chosen based on their strengths, to construct a custom toolbox for rapid fluvial geomorphology analysis.
- ArcGIS Desktop -Desktop (ArcMap and ArcGIS Pro) are industry standard enterprise desktop GIS products for conducting geospatial analysis. The ArcGIS desktop applications contain an enormous number of commercial-off-the shelf (COTS) geospatial tools for performing sophisticated analyses and visualization.
- ArcGIS toolbox - ArcGIS Desktop allows for the creation of sophisticated custom geospatial toolboxes to be built that combine ESRI’s COTS geoprocessing tools with user created tools from several platforms (e.g., Python, R).
- Python - ArcGIS provides a robust scripting interface to its GIS tools using the Python language. Custom geospatial toolboxes can combine ESRI’s COTS geoprocessing tools with tools available within the diverse, mature, and ever-growing Python data science ecosystem.
- R - ESRI’s ArcGIS R-bridge product allows R tools to be called within the ArcGIS toolbox interface. This allows ArcGIS tools to take advantage of the mature ecosystem of R data science, statistical, visualization, and report generation packages.
4.2 Packages
The FluvialGeomorph toolbox is composed of a set of tightly connected packages that work together to complete the analysis. Modular design was a conscious architectural decision made to take advantage of the best tools and to help support long-term maintenance. Links are provided below to each package’s online code repository.
- The
FluvialGeomorphtoolbox - This is the primary user-facing software component. It is an ArcGIS toolbox organized as a Python package. The custom Python tools in this toolbox perform primarily geospatial operations, where the ESRI platform excels (e.g., linear referencing). It also performs the installation of the needed R packages. - The
fluvgeoR package - This custom R package developed for this project contains the bulk of the data science, statistical, visualization, and reporting functions, where the R platform excels. - The
RegionalCurveR package - This custom R package developed for this project contains the data and functions for accessing regional hydraulic geometry studies.
4.3 ArcGIS Toolbox
The FluvialGeomorph toolbox contains a set of tools for analyzing streams. These tools are divided into four toolsets.
4.3.1 01 - Install toolset
The purpose of this toolset is to hold the tools needed to install and troubleshoot the FluvialGeomorph toolbox software components.
4.3.1.1 Install R Packages
Purpose - This tool installs the R packages required by the FluvialGeomorph toolbox using these instructions in the user manual. This tool also sets several configuration settings.
Code - This ArcGIS script tool calls the R script FluvialGeomorph-toolbox/install/Install_FG_R.R.
4.3.1.2 R Session Info
Purpose - This tool provides the output of the current R session. This is helpful for troubleshooting R environment issues during installation.
Code - This ArcGIS script tool calls the R script FluvialGeomorph-toolbox/install/session.R.
4.3.2 02 - Tools toolset
The purpose of this toolset is to hold the tools that perform the FluvialGeomorph analysis.
4.3.2.1 02 - Hydro DEM
Purpose - This tool “burns” (sets the elevation to the same value for all pixels along the extent of the polyline feature) a cutlines feature class into the supplied DEM and creates the dem_hydro in the output workspace using these instructions in the user manual. See this section for a detailed discussion of why hydro modification is required.
Code - This ArcGIS script tool calls the Python script FluvialGeomorph-toolbox/tools/_02_HydroDEM.py.
Parameters - This tool contains the following parameters:
| Parameter | Type | Description | Required |
|---|---|---|---|
| output_workspace | Workspace | Path to the output workspace. | required |
| cutlines | Feature Class | Path to the cutlines feature class. |
required |
| dem | Raster Dataset | Path to the digital elevation model (DEM). | required |
| widen_cells | long | Number of cells to widen the cutline by. | optional |
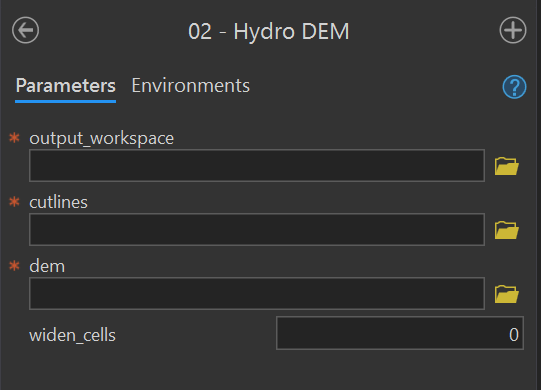
Figure 4.1: 02 - Hydro DEM Tool Dialog.
4.3.2.2 03 - Contributing Area
Purpose - This tool calculates the D-infinity contributing area for each pixel in the input DEM and creates a contributing_area raster in the output workspace using these instructions in the user manual.
Code - This ArcGIS script tool calls the Python script FluvialGeomorph-toolbox/tools/_03_ContributingArea.py. This Python script uses the TauDEM D-Infinity Contributing Area tool to calculate the specific catchment area (which is the contributing area per unit contour length using the multiple flow direction D-infinity approach).
Parameters - This tool contains the following parameters:
| Parameter | Type | Description | Required |
|---|---|---|---|
| output_workspace | Workspace | Path to the output workspace. | required |
| dem | Raster Dataset | Path to the digital elevation model (DEM). | required |
| processes | long | The number of stripes that the DEM will be divided into and the number of MPI parallel processes that will be spawned to evaluate each of the stripes. It is recommended to use no more than the number of cores on your computer. | required |
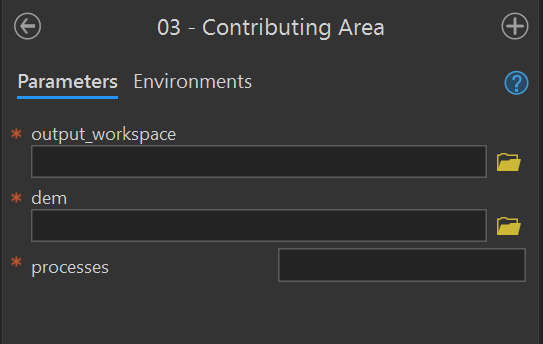
Figure 4.2: 03 - Contributing Area Tool.
4.3.2.3 03a - Contributing Area D8
Purpose - This tool creates the D8 flow_accumulation_d8 and flow_direction_d8 rasters in the output workspace for a given input DEM using these instructions in the user manual.
Code - This ArcGIS script tool calls the Python script FluvialGeomorph-toolbox/tools/_03a_ContributingAreaD8.py.
Parameters - This tool contains the following parameters:
| Parameter | Type | Description | Required |
|---|---|---|---|
| output_workspace | Workspace | Path to the output workspace. | required |
| dem | Raster Dataset | Path to the digital elevation model (DEM). | required |
| processes | long | The number of stripes that the DEM will be divided into and the number of MPI parallel processes that will be spawned to evaluate each of the stripes. It is recommended to use no more than the number of cores on your computer. | required |
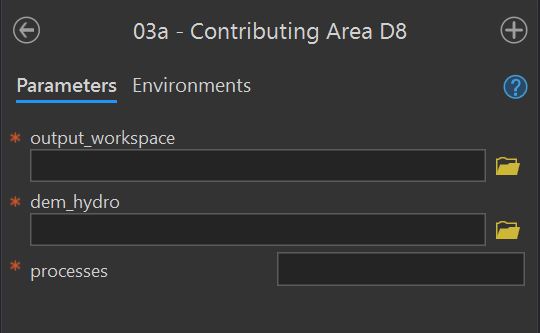
Figure 4.3: 03a - Contributing Area D8 Tool.
4.3.2.4 04 - Stream Network
Purpose - This tool creates the synthetic flow network stream_network polyline feature class from a contributing_area raster for a given stream initiation threshold using these instruction in the user manual.
Code - The ArcGIS script tool calls the Python script FluvialGeomorph-toolbox/tools/_04_StreamNetwork.py.
Parameters - This tool contains the following parameters:
| Parameter | Type | Description | Required |
|---|---|---|---|
| output_workspace | Workspace | Path to the output workspace. | required |
| contrib_area | Raster Dataset | Path to the D-Infinity contributing area raster created by the Contributing Area tool. | required |
| threshold | long | Flow accumulation threshold to initiate a stream expressed in the units of the source DEM used to accumulate the flow. | required |
| processes | long | The number of stripes that the DEM will be divided into and the number of MPI parallel processes that will be spawned to evaluate each of the stripes. It is recommended to use no more than the number of cores on your computer. | required |
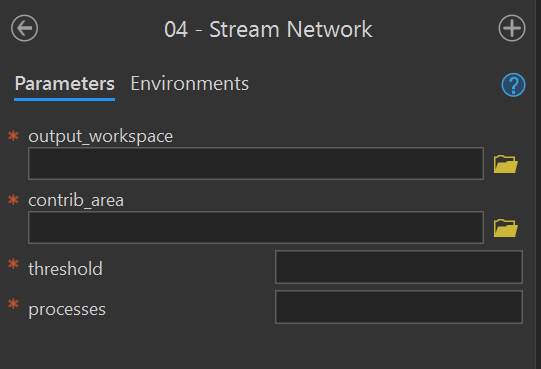
Figure 4.4: 04 - Stream Network Tool.
4.3.2.5 04a - Stream Network Points
Purpose - This tool converts the stream_network to the stream_network_points points feature class using the these instructions from the user manual. This tool extracts elevation information from the DEM and calculates the drainage area.
Code - This ArcGIS script tool calls the Python script FluvialGeomorph-toolbox/tools/_04a_StreamNetworkPoints.py.
Parameters - This tool contains the following parameters:
| Parameter | Type | Description | Required |
|---|---|---|---|
| output_workspace | Workspace | Path to the output workspace. | required |
| stream_network | Feature Class | Path to the edited stream_network feature class. |
required |
| flow_accum | Raster Dataset | Path to the flow accumulation model. | required |
| dem | Raster Dataset | Path to the digital elevation model (DEM). | required |
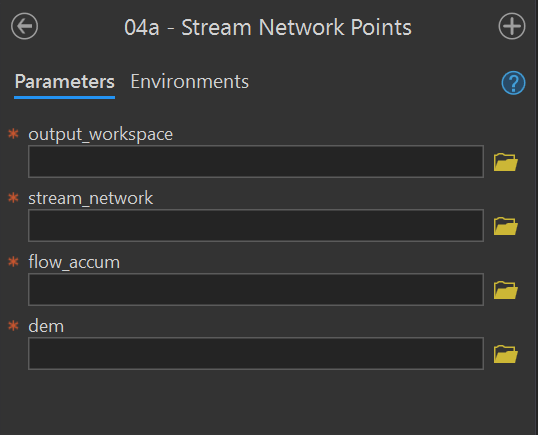
Figure 4.5: 04a - Stream Network Point Tool.
4.3.2.6 04b - Slope and Sinuosity
Purpose - This tool calculates the gradient_* points feature class for a flowline_points or stream_network feature class using these instructions from the user manual.
Code - This ArcGIS script tool calls the Python script FluvialGeomorph-toolbox/tools/_04b_Gradient.R. This Python script call the R function fluvgeo::slope_sinuosity.
Parameters - This tool contains the following parameters:
| Parameter | Type | Description | Required |
|---|---|---|---|
| flowline_points_fc | Feature Class | The full path to a flowline_points feature class. |
required |
| gradient_distance | double | The number of features to lead (upstream) and lag (downstream) to calculate the slope and sinuosity. Must be an integer. | required |
| use_smoothing | Boolean | Determines if smoothed elevation values are used to calculate gradient and sinuosity (default is FALSE). | required |
| loess_span | double | The loess regression span parameter (defaults to 0.05). | required |
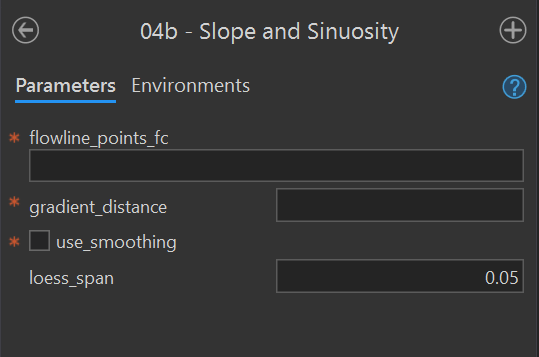
Figure 4.6: 04b - Slope and Sinuosity Tool.
4.3.2.7 04c - Watershed
Purpose - This tool creates the watershed polygon feature class in the output workspace using these instructions from the user manual. This tool calculates the extent of the upstream drainage area for each point feature in the input watershed_points point feature class. This tool optionally calculates the landcover proportion in each watershed feature.
Code - This ArcGIS script tool calls the Python script FluvialGeomorph-toolbox/tools/_04c_Watersheds.py.
Parameters - This tool contains the following parameters:
| Parameter | Type | Description | Required |
|---|---|---|---|
| output_workspace | Workspace | Path to the output workspace. | required |
| points | Feature Class | Path to the watershed_points feature class. |
required |
| point_ID_field | Field | Field in the watershed_points feature class that contains the point IDs. |
required |
| flow_accumulation_d8 | Raster Dataset | Path to the flow accumulation model. | required |
| flow_direction_d8 | Raster Dataset | Path to the flow_direction_d8 model (must use D8 method). |
required |
| snap_distance | double | The distance the point will be snapped to find the cell of highest flow accumulation. | required |
| landcover | Raster Dataset | Path to a categorical land cover raster. | optional |
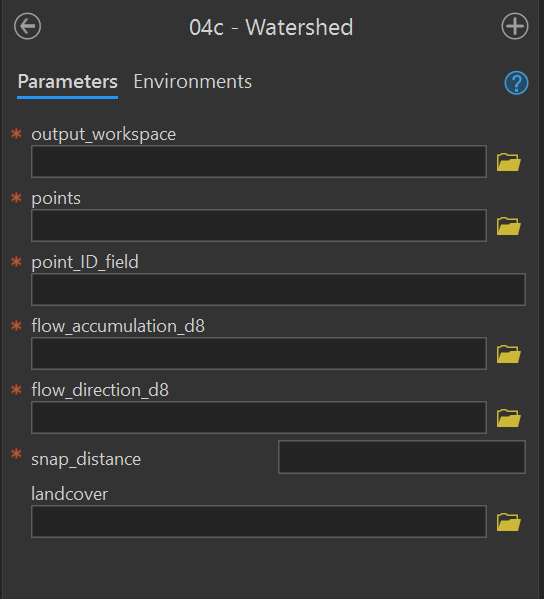
Figure 4.7: 04c - Watershed Tool.
4.3.2.8 05 - Flowline
Purpose - This tool creates a flowline feature class in the output workspace using these instructions from the user manual. This tool uses an edited stream_network feature class to derive the flowline.
Code - This ArcGIS script tool calls the Python script FluvialGeomorph-toolbox/tools/_05_Flowline.py.
Parameters - This tool contains the following parameters:
| Parameter | Type | Description | Required |
|---|---|---|---|
| output_workspace | Workspace | Path to the output workspace. | required |
| stream_network | Feature Class | Path to the edited stream_network feature class. |
required |
| smooth_tolerance | long | The PAEK smoothing tolerance that controls the calculating of new vertices. Acceptable smoothing occurs with values between 2 - 5. | required |
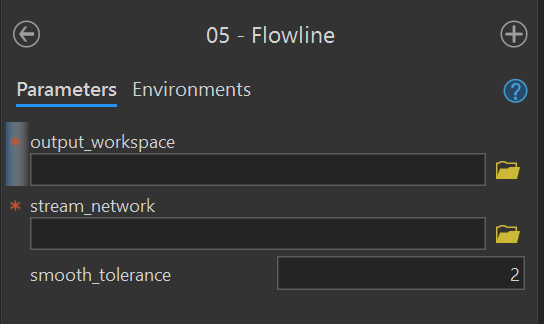
Figure 4.8: 05 - Flowline Tool.
4.3.2.9 06 - Flowline Points
Purpose - This tool creates a flowline_points feature class in the output workspace using these instructions from the user manual. This tool converts a stream flowline feature class to a route and begins the stationing using the km_to_mouth parameter. This tool can optionally calibrate the output flowline_points using a point feature class.
Code - This ArcGIS script tool calls the Python script FluvialGeomorph-toolbox/tools/_06_FlowlinePoints.py.
Parameters - This tool contains the following parameters:
| Parameter | Type | Description | Required |
|---|---|---|---|
| output_workspace | Workspace | Path to the output workspace. | required |
| flowline | Feature Class | Path to the flowline feature class. |
required |
| dem | Raster Dataset | Path to the digital elevation model (DEM). | required |
| km_to_mouth | double | Kilometers to the mouth of the study area outlet. | required |
| station_distance | double | Distance between output flowline station points (in the linear units of the flowline feature class). | required |
| calibration_points | Feature Class | A point feature class used to calibrate the output flowline_points. |
optional |
| point_ID_field | Field | The field that identifies the route on which each calibration point is located.The values in this field match those in the route identifier field. This field can be numeric or character. If using a flowline_points feature class, the id_field is “ReachName.” | optional |
| measure_field | Field | The field containing the measure value for each calibration point. This field must be numeric. If using a flowline_points feature class, the measure_field is “POINT_M.” | optional |
| search_radius | string | Limits how far a calibration point can be from a route by specifying the distance and its unit of measure (e.g., “25 Meters”). If the units of measure are not specified, the same units as the coordinate system of the route feature class will be used. | optional |
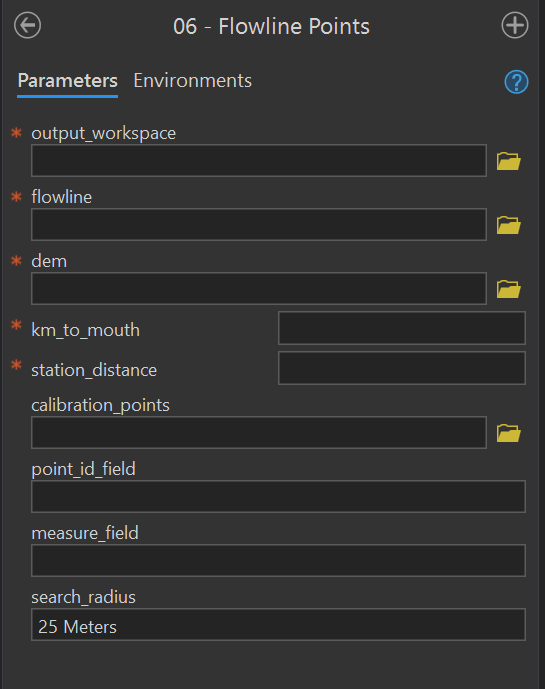
Figure 4.9: 06 - Flowline Points Tool.
4.3.2.10 07 - Detrend DEM
This tool creates the detrend raster using these instructions from the user manual. This tool uses flowline_points to remove the elevation trend from the stream reach. See this section for a detailed discussion on detrended DEMs.
Code - This ArcGIS script tool calls the Python script FluvialGeomorph-toolbox/tools/_07_DetrendDEM.py.
Parameters - This tool contains the following parameters:
| Parameter | Type | Description | Required |
|---|---|---|---|
| output_workspace | Workspace | Path to the output workspace. | required |
| flowline | Feature Class | Path to the flowline feature class. |
required |
| flowline_points | Feature Class | Path to the flowline_points feature class. |
required |
| dem | Raster Dataset | Path to the digital elevation model (DEM). | required |
| buffer distance | double | Distance the flowline_points feature class will be buffered to define the extent of the output detrended DEM. Units are defined by the coordinate system of the DEM. |
required |
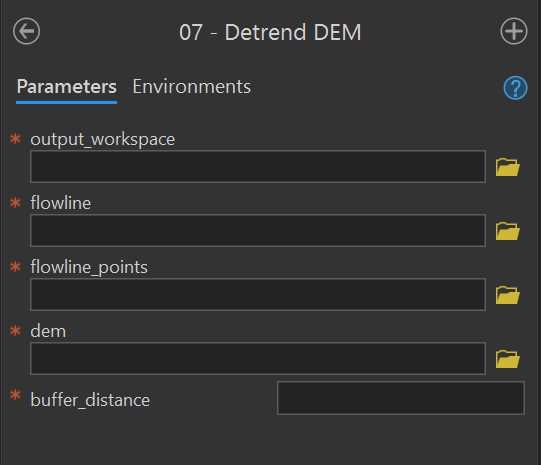
Figure 4.10: 07 - Detrend Tool.
4.3.2.11 08 - Water Surface Extent
Purpose - This tool creates the banks_raw polygon feature class using these Level 1 instructions from the user manual and these instructions for Level 2.
Code - This ArcGIS script tool calls the Python script FluvialGeomorph-toolbox/tools/_08_WaterSurfaceExtent.py.
Parameters - This tool contains the following parameters:
| Parameter | Type | Description | Required |
|---|---|---|---|
| output_workspace | Workspace | Path to the output workspace. | required |
| detrend_dem | Raster Dataset | Path to the detrended digital elevation model (DEM). | required |
| detrend_value | double | Detrended elevation value used to define the innundated area. All raster values below this value will be extracted to a polygon. | required |
| smoothing | double | Smoothing factor (0, no smoothing - 5, high smoothing) | required |
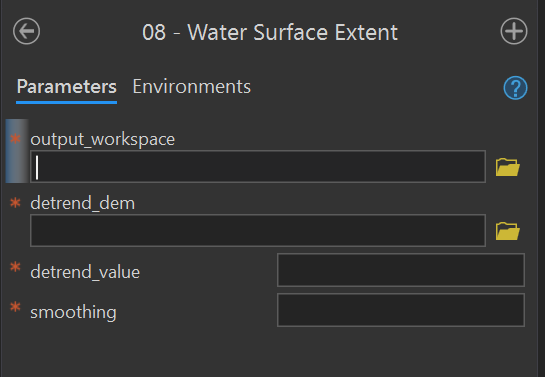
Figure 4.11: 08 - Water Surface Extent Tool.
4.3.2.12 09 - Channel Slope
Purpose - This tool creates the channel_slope raster using these instructions in the user manual. This tool uses banks extent polygon to calculate a slope raster for the channel area.
Code - This ArcGIS script tool calls the Python script FluvialGeomorph-toolbox/tools/_09_ChannelSlope.py.
Parameters - This tool contains the following parameters:
| Parameter | Type | Description | Required |
|---|---|---|---|
| output_workspace | Workspace | Path to the output workspace. | required |
| dem | Raster Dataset | Path to the digital elevation model (DEM). | required |
| banks_poly | Feature Class | Path to a banks polygon feature class representing the channel area for which slope will be calculated. | required |
| z_factor | double | Number of ground x,y units in one surface z unit. | required |
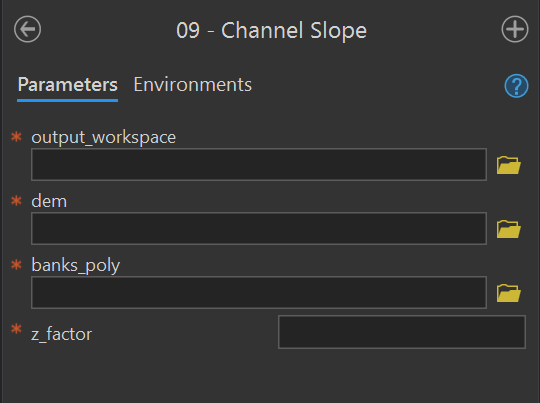
Figure 4.12: 09 - Channel Slope Tool.
4.3.2.13 10 - Centerline
Purpose - This tool creates the centerline polyline feature class using these instructions for Level 1 and Level 2 from the user manual. The centerline is the strem flow path that lies midway between the banks at bankfull.
Code - This ArcGIS script tool calls the Python script FluvialGeomorph-toolbox/tools/_10_Centerline.py.
Parameters - This tool contains the following parameters:
| Parameter | Type | Description | Required |
|---|---|---|---|
| output_workspace | Workspace | Path to the output workspace. | required |
| dem | Raster Dataset | Path to the digital elevation model (DEM). | required |
| banks_poly | Feature Class | Path to a banks polygon representing the channel area for which slope will be calculated. | required |
| smooth_tolerance | long | The PAEK smoothing tolerance that controls the calculating of new vertices. Acceptable smoothing occurs with values between 2 - 5. | required |
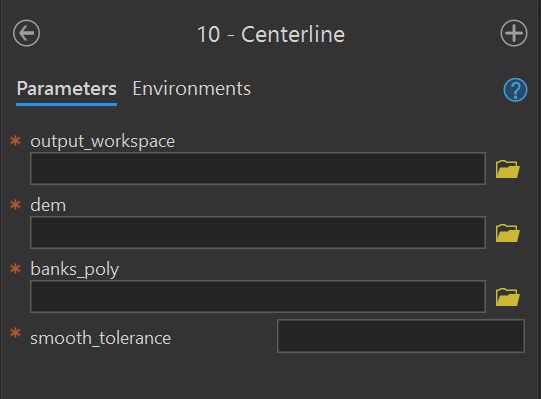
Figure 4.13: 10 - Centerline Tool.
4.3.2.14 11 - XS Layout
Purpose - This tool creates the xs_* polyline feature class using these instructions from the user manual. This tool creates a set of regularly spaced cross sections along the input flowline at the specified longitudinal spacing and lateral width. The output feature class is named xs_<transect_spacing>_<transect_width>.
Code - This ArcGIS script tool calls the Python script FluvialGeomorph-toolbox/tools/_11_XSLayout.py.
Parameters - This tool contains the following parameters:
| Parameter | Type | Description | Required |
|---|---|---|---|
| output_workspace | Workspace | Path to the output workspace. | required |
| flowline | Feature Class | Path to the flowline feature class. |
required |
| split_type | string | Method for placing cross sections along the flowline. “Split at approximate distance” places cross sections along the flowline at the value of transect_spacing. “Split at vertices” places cross sections at the nearest existing flowline vertex. | required |
| transect_spacing | double | The distance between cross sections as measured along the flowline. Uses units of the input flowline. | required |
| transect_width | double | The width of the cross section as measured from the flowline to its furthest outside point. Therefore, a value of 50 ft for transect_width will result in a cross section with an overall width of 100 ft (50 ft on the right descending bank and 50 ft on the left descending bank). | required |
| transect_width_unit | string | The unit of the transect_width. | required |
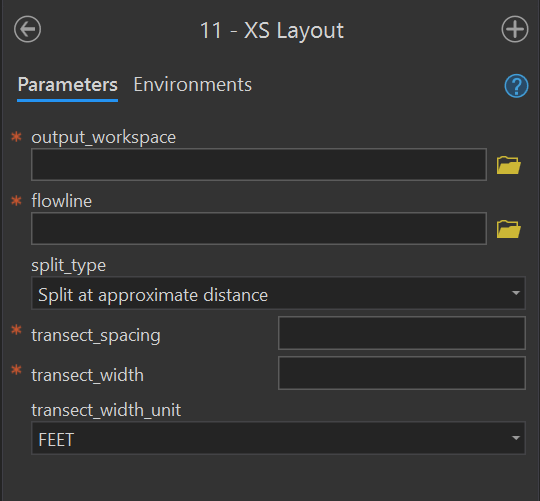
Figure 4.14: 11 - XS Layout Tool.
4.3.2.15 12 - XS Watershed Area
Purpose - This tool adds or updates the field Watershed_Area_SqMile to the input cross section feature class using these instructions for Level 1 and Level 2 from the user manual. This field records the upstream drainage area for the cross section.
Code - This ArcGIS script tool calls the Python script FluvialGeomorph-toolbox/tools/_12_XSWatershedArea.py.
Parameters - This tool contains the following parameters:
| Parameter | Type | Description | Required |
|---|---|---|---|
| output_workspace | Workspace | Path to the output workspace. | required |
| cross_section | Feature Class | Path to the cross section line feature class. | required |
| flowline | Feature Class | Path to the flowline feature class. |
required |
| flow_accum | Raster Dataset | Path to the flow accumulation model. | required |
| snap_distance | double | The distance the point will be snapped to find the cell of highest flow accumulation. | required |
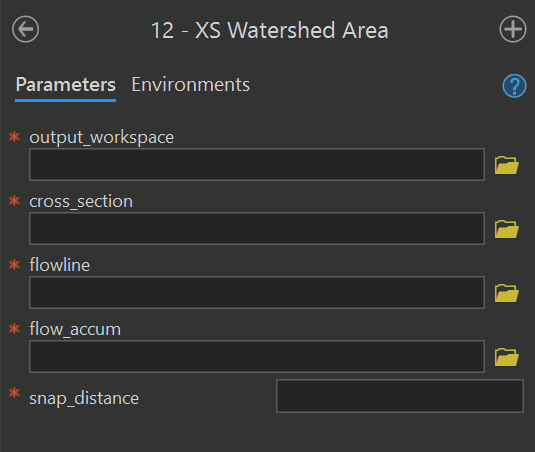
Figure 4.15: 12 - XS Watershed Area Tool.
4.3.2.16 13 - XS River Position
Purpose - This tool adds or updates the field km_to_mouth to the input cross section feature class using these instructions for Level 1 and Level 2 from the user manual. This field records the distance of the cross section from the mouth of the site.
Code - This ArcGIS script tool calls the Python script FluvialGeomorph-toolbox/blob/_13_XSRiverPosition.py.
Parameters - This tool contains the following parameters:
| Parameter | Type | Description | Required |
|---|---|---|---|
| output_workspace | Workspace | Path to the output workspace. | required |
| cross_section | Feature Class | Path to the cross section line feature class. | required |
| flowline_points | Feature Class | Path to the flowline_points feature class. |
required |
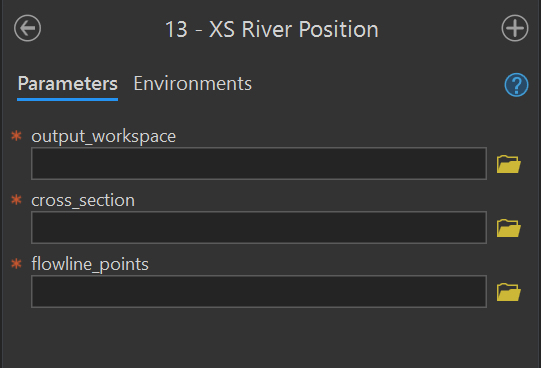
Figure 4.16: 13 - XS River Position Tool.
4.3.2.17 13a - XS Resequence
Purpose - This tools reorders the values of the Seq field for the input cross section feature class using these instructions from the user manual.
Code - This ArcGIS script tool calls the Python script FluvialGeomorph-toolbox/tools/_13a_XSResequence.py.
Parameters - This tool contains the following parameters:
| Parameter | Type | Description | Required |
|---|---|---|---|
| output_workspace | Workspace | Path to the output workspace. | required |
| xs_fc | Feature Class | Path to a cross section feature class. | required |
| start_seq | long | The starting value of the Seq field. |
required |
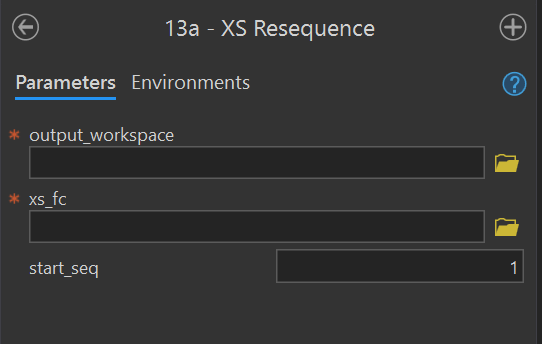
Figure 4.17: 13a - XS Resequence Tool.
4.3.2.18 14 - XS Points
Purpose - This tool creates the *_points points feature class using the these instructions for Level 1 and Level 2 from the user manual. This tool converts a cross section polyline feature class (i.e., xs_*, riffle_floodplain, riffle_channel) into a series of points stationed at the station_distance along the input cross section. The name of the input cross section prepended to the output feature class: <cross_section name>_points.
Code - This ArcGIS script tool calls the Python script FluvialGeomorph-toolbox/tools/_14_XSPoints.py.
Parameters - This tool contains the following parameters:
| Parameter | Type | Description | Required |
|---|---|---|---|
| output_workspace | Workspace | Path to the output workspace. | required |
| cross_section | Feature Class | Path to the cross section line feature class. | required |
| dem | Raster Dataset | Path to the digital elevation model (DEM). | required |
| dem_units | string | Vertical units of the DEM. Select one of “m” or “ft.” | required |
| detrend_dem | Raster Dataset | Path to the detrended digital elevation model (DEM). | required |
| station_distance | double | Distance between output flowline station points (in the linear units of the flowline feature class). | required |
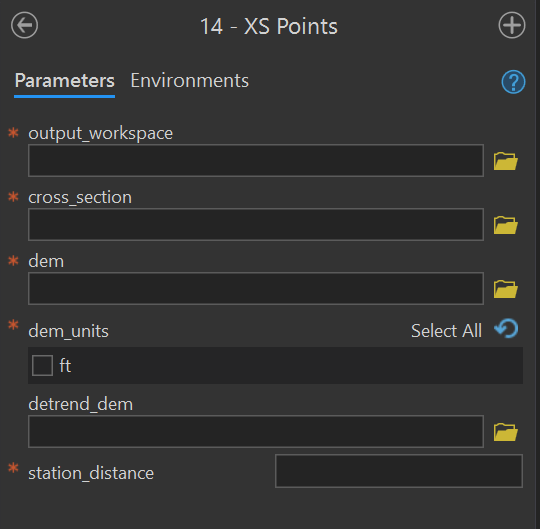
Figure 4.18: 14 - XS Points Tool.
4.3.2.19 14b - Bankline Points
Purpose - This tool creates the bankline_points using these instructions in the user manual. This tool uses the loop_points and valleyline that the analyst manually created in previous steps.
Code - This ArcGIS script tool calls the Python script FluvialGeomorph-toolbox/tools/_14b_BanklinePoints.py
Parameters - This tool contains the following parameters:
| Parameter | Type | Description | Required |
|---|---|---|---|
| output_workspace | Workspace | Path to the output workspace. | required |
| loop_points | Feature Class | Path to the loop_points feature class. |
required |
| banklines | Feature Class | Path to the banklines feature class. |
required |
| valleyline | Feature Class | Path to the valleyline feature class. |
required |
| dem | Raster Dataset | Path to the digital elevation model (DEM). | required |
| station_distance | double | Distance between output flowline station points (in the linear units of the flowline feature class). | required |
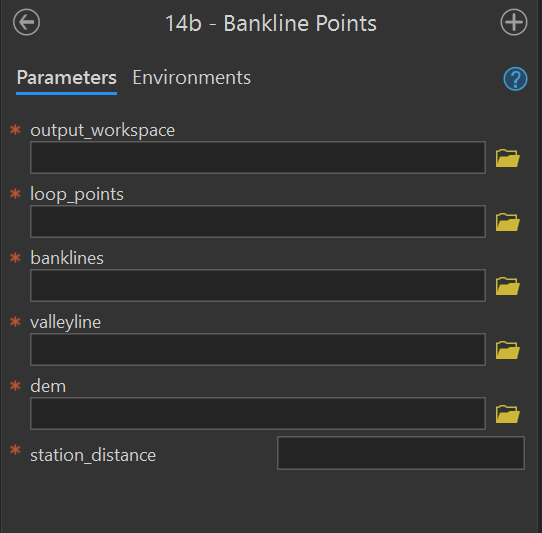
Figure 4.19: 14b - Bankline Points Tool.
4.3.2.20 14c - XS Assign Loops
Purpose - This tool assigns loops and bends to input cross section feature class using the input bankline_points using these instructions in the user manual.
Code - This ArcGIS script tool calls the Python script FluvialGeomorph-toolbox/tools/_14c_XSAssignLoops.py.
Parameters - This tool contains the following parameters:
| Parameter | Type | Description | Required |
|---|---|---|---|
| output_workspace | Workspace | Path to the output workspace. | required |
| cross_section | Feature Class | Path to the cross section line feature class. | required |
| bankline_points | Feature Class | Path to the bankline_points feature class. |
required |
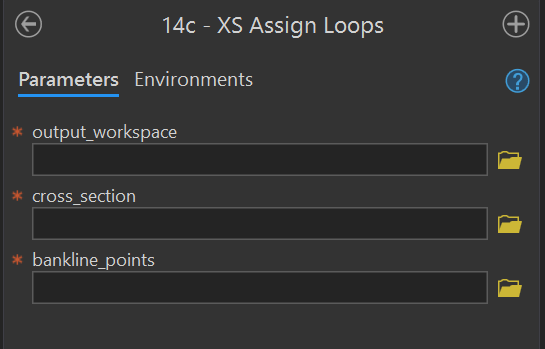
Figure 4.20: 14c - XS Assign Loops Tool.
4.3.2.21 15a - XS Dimensions, Level 1
purpose - This tool calculates Level 1 cross section dimensions for the input cross section feature class (i.e., regular cross sections) using these instructions from the user manual.
Code - This ArcGIS script tool calls the Python script FluvialGeomorph-toolbox/tools/_15a_XSDimensions.R which calls the R function fluvgeo::cross_section_dimensions_L1.
Parameters - This tool contains the following parameters:
| Parameter | Type | Description | Required |
|---|---|---|---|
| xs_fc | Feature Class | Path to a cross section feature class. | required |
| lead_n | long | The number of cross sections to lead (upstream) and lag (downstream) on either side of each cross section to calculate the slope and sinuosity. Must be an integer. | required |
| use_smoothing | Boolean | Determines if smoothed elevation values are used to calculate gradient and sinuosity (default is FALSE). | required |
| loess_span | double | The loess regression span parameter (defaults to 0.05). | required |
| vert_units | string | The DEM vertical units. One of: “m” (meter), “ft” (foot), “us-ft” (us survey foot). | required |
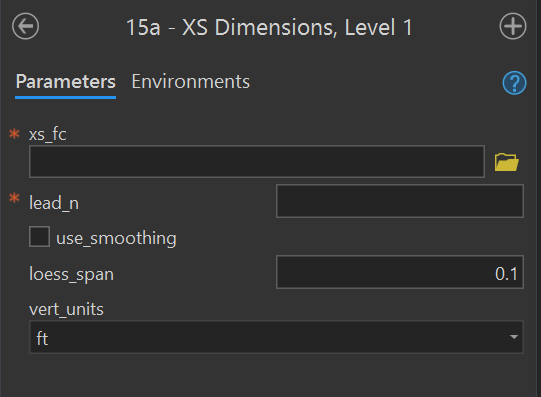
Figure 4.21: 15a - XS Dimensions, Level 1 Tool.
4.3.2.22 15b - XS Dimensions, Level 2
Purpose - This tool calculates Level 3 cross section dimensions for the input cross section feature class (i.e., regular cross sections, riffle cross sections) using these instructions from the user manual.
Code - This ArcGIS script tool calls the Python script FluvialGeomorph-toolbox/tools/_15b_XSDimensions.R
Parameters - This tool contains the following parameters:
| Parameter | Type | Description | Required |
|---|---|---|---|
| xs_fc | Feature Class | Path to a cross section feature class. | required |
| xs_points_fc | Feature Class | The path to an cross section points feature class. | required |
| bankfull_elevation | double | The bankfull elevation (in detrended feet) that is used to calculate hydraulic geometry. | required |
| lead_n | long | The number of cross sections to lead (upstream) and lag (downstream) on either side of each cross section to calculate the slope and sinuosity. Must be an integer. | required |
| use_smoothing | Boolean | Determines if smoothed elevation values are used to calculate gradient and sinuosity (default is FALSE). | required |
| loess_span | double | The loess regression span parameter (defaults to 0.05). | required |
| vert_units | string | The DEM vertical units. One of: “m” (meter), “ft” (foot), “us-ft” (us survey foot). | required |
| discharge_method | string | The method for calculating discharge (Q). Must be one of: “model_measure,” “regional_curve,” “width_relationship.” | required |
| discharge_value | double | The discharge value (single value or vector) to use for the stream power calculation. Required if discharge_method = “model_measure.” | optional |
| region | string | The regional curve name used to calculate discharge. Required if discharge_method = “regional_curve.” This parameter is passed to the RegionalCurve::RHG function. See the RegionalCurve package for a list of regions with discharge relationships. | optional |
| drainage_area | double | The drainage area (single value or vector) used by the RegionalCurve::RHG function to calculate discharge. Required if discharge_method = “regional_curve.” | optional |
| width_method | string | The name of the width relationship used to calculate discharge (Q) from width. Required if discharge_method = “width_relationship.” Must be one of:
|
optional |
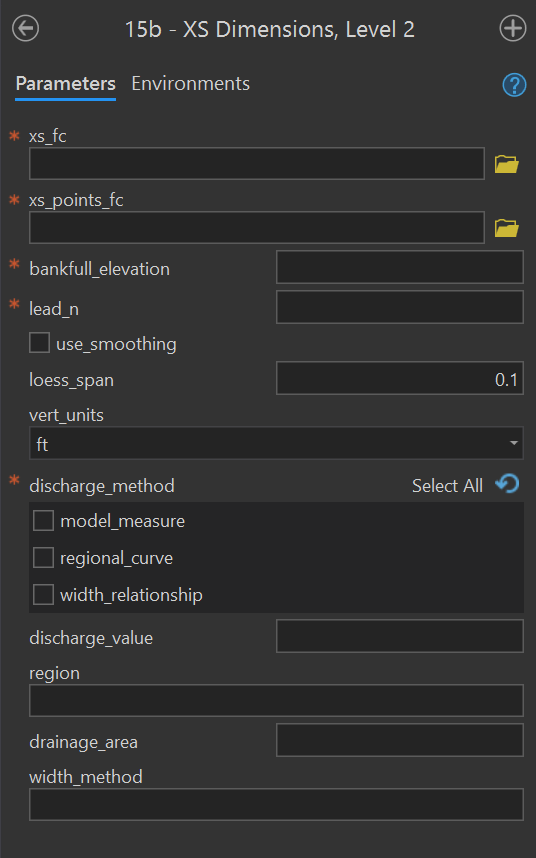
Figure 4.22: 15b - XS Dimensions, Level 2 Tool.
4.3.2.23 15c - XS Planform, Level 3
Purpose - This tool calculates Level 3 cross section dimensions for the input cross section feature class (i.e., regular cross sections, riffle cross sections) using these instructions from the user manual.
Code - This ArcGIS script tool calls the Python script FluvialGeomorph/FluvialGeomorph-toolbox/tools/_15c_XSPlanform.R which calls the R functions fluvgeo::planform_dimensions to calculate the planform dimensions and fluvgeo::xs_metric_ratios to calculate the metric ratios.
Parameters - This tool contains the following parameters:
| Parameter | Type | Description | Required |
|---|---|---|---|
| xs_dimensions | Feature Class | Path to a Level 2 cross section dimension line feature class. | required |
| bankline_points | Feature Class | Path to an bankline_points point feature class. |
required |
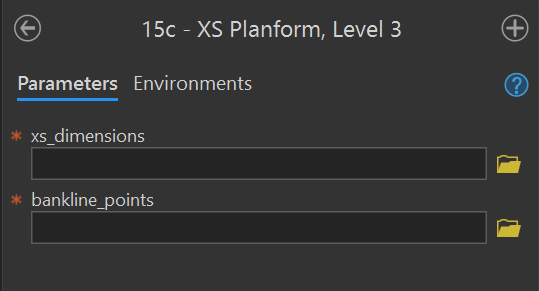
Figure 4.23: 15b - XS Dimensions, Level 3 Tool.
4.3.2.24 16 - XS RAS Watersurface
Purpose - This tool adds or updates the field ras_wse_* to a cross section dimensions feature class using these instructions for Level 2 and Level 3 from the user manual.
Code - This ArcGIS script tool calls the Python script FluvialGeomorph-toolbox/tools/_16_XS_RAS_WaterSurface.py.
Parameters - This tool contains the following parameters:
| Parameter | Type | Description | Required |
|---|---|---|---|
| output_workspace | Workspace | Path to the output workspace. | required |
| xs_dimensions | Feature Class | Path to a cross section dimension line feature class. | required |
| RAS_depth | string | Path to the RAS model depth raster (elevation units feet). | required |
| RAS_model_name | string | Name of the RAS model that the depth raster represents. This name will be used to name the calculated WSE fields. | required |
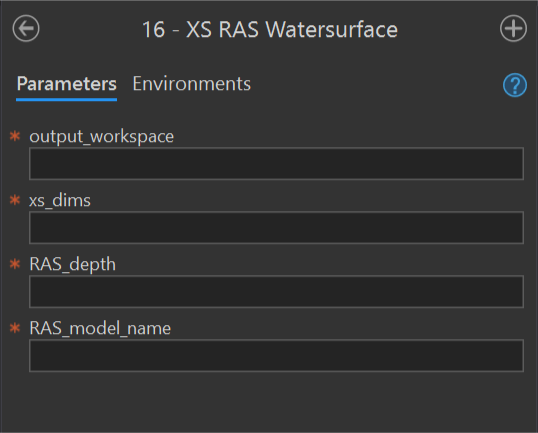
Figure 4.24: 16 - XS RAS Watersurface Tool.
4.3.3 03 - Reports toolset
The purpose of this toolset is to hold the tools that produce the FluvialGeomorph reports.
4.3.3.1 Graph - Longitudinal Profile Compare
Purpose - This tool produces the longitudinal profile plot from the flowline_points feature classes of a stream reach taken from one or more surveys. This tool compares longitudinal profile plots from multiple surveys. It labels the plot using the features feature class along the x-axis.
Code - This ArcGIS script tool calls the R script FluvialGeomorph-toolbox\report\_Longitudinal_Profile_Compare.R which calls the R function fluvgeo::compare_long_profile.
Parameters - This tool contains the following parameters:
| Parameter | Type | Description | Required |
|---|---|---|---|
| stream | string | The name of the stream reach. | required |
| flowline_points_1 | Feature Class | Path to the flowline points feature class of the first survey. |
required |
| flowline_points_2 | Feature Class | Path to the flowline points feature class of the second survey. |
optional |
| flowline_points_3 | Feature Class | Path to the flowline points feature class of the third survey. |
optional |
| flowline_points_4 | Feature Class | Path to the flowline points feature class of the fourth survey. |
optional |
| survey_name_1 | string | The label to use for the first survey. | required |
| survey_name_2 | string | The label to use for the second survey. | optional |
| survey_name_3 | string | The label to use for the third survey. | optional |
| survey_name_4 | string | The label to use for the fourth survey. | optional |
| features_fc | Feature Class | A stream reach features feature class. |
required |
| profile_units | string | The units of the longitudinal profile. | required |
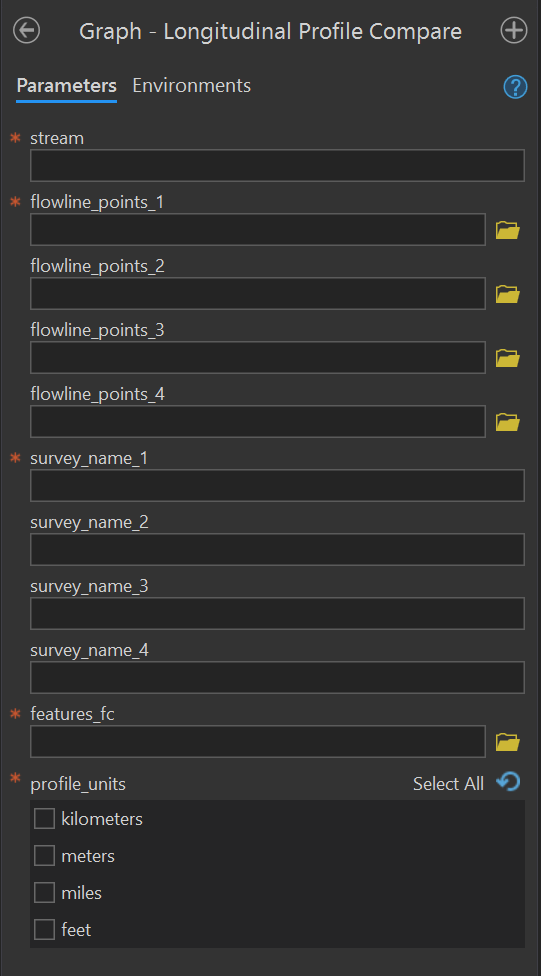
Figure 4.25: Graph - Longitudinal Profile Compare Tool.
4.3.3.2 Graph - XS Longitudinal Profile Compare
Tool in progress.
4.3.3.3 Map - Reach Overview
Purpose - This tool produces a reach overview map figure from a flowline and a regular cross section or a riffle cross section feature class.
Code - This ArcGIS script tool calls the R script FluvialGeomorph-toolbox/report/_Reach_Overview_Map.R which calls the R function fluvgeo::map_reach_overview.
Parameters - This tool contains the following parameters:
| Parameter | Type | Description | Required |
|---|---|---|---|
| flowline | Feature Class | Path to the flowline feature class. |
required |
| cross_section | Feature Class | Path to a cross section feature class. | required |
| xs_label_freq | double | An integer indicating the frequency of cross section labels. | required |
| background | string | The type of map background. One of “aerial” or “elevation.” | required |
| exaggeration | double | The degree of terrain exaggeration. | required |
| extent_factor | double | The amount the extent is expanded around the cross section feature class. Values greater than one zoom out, values less than one zoom in. | required |
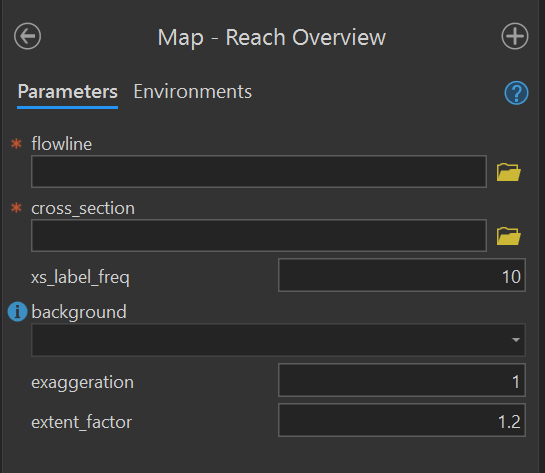
Figure 4.26: Map - Reach Overview Tool.
4.3.3.4 Report - L1
Purpose - This tool produces the Level 1 Report using these instructions from the user manual.
Code - This ArcGIS script tool calls the R script FluvialGeomorph-toolbox/report/_Level_1_Report.R which calls the R function fluvgeo::level_1_report.
Parameters - This tool contains the following parameters:
| Parameter | Type | Description | Required |
|---|---|---|---|
| stream | string | The name of the stream reach. | required |
| flowline_fc | Feature Class | Path to the flowline feature class. |
required |
| xs_dimensions_fc | Feature Class | The path to a Level 1 cross section dimensions feature class. | required |
| flowline_points_1 | Feature Class | Path to the flowline points feature class of the first survey. |
required |
| flowline_points_2 | Feature Class | Path to the flowline points feature class of the second survey. |
optional |
| flowline_points_3 | Feature Class | Path to the flowline points feature class of the third survey. |
optional |
| flowline_points_4 | Feature Class | Path to the flowline points feature class of the fourth survey. |
optional |
| xs_points_1 | Feature Class | The path to a cross section points feature class for the first time period. | required |
| xs_points_2 | Feature Class | The path to a cross section points feature class for the second time period. | optional |
| xs_points_3 | Feature Class | The path to a cross section points feature class for the third time period. | optional |
| xs_points_4 | Feature Class | The path to a cross section points feature class for the fourth time period. | optional |
| survey_name_1 | string | The label to use for the first survey. | required |
| survey_name_2 | string | The label to use for the second survey. | optional |
| survey_name_3 | string | The label to use for the third survey. | optional |
| survey_name_4 | string | The label to use for the fourth survey. | optional |
| features_fc | Feature Class | A stream reach features feature class. |
required |
| dem | Raster Dataset | Path to the digital elevation model (DEM). | required |
| show_xs_map | boolean | Add the cross section maps to the report? | required |
| profile_units | string | The units of the longitudinal profile. | required |
| aerial | boolean | Display an overview map with an aerial photo background? | required |
| elevation | boolean | Display an overview map with an elevation background? | required |
| xs_label_freq | double | An integer indicating the frequency of cross section labels. | required |
| exaggeration | double | The degree of terrain exaggeration. | required |
| extent_factor | double | The amount the extent is expanded around the cross section feature class. Values greater than one zoom out, values less than one zoom in. | required |
| output_dir | Folder | The path to the folder in which to write the report. | required |
| output_format | string | The file format of the report. One of “html_document,” “word_document,” “pdf_document.” | required |
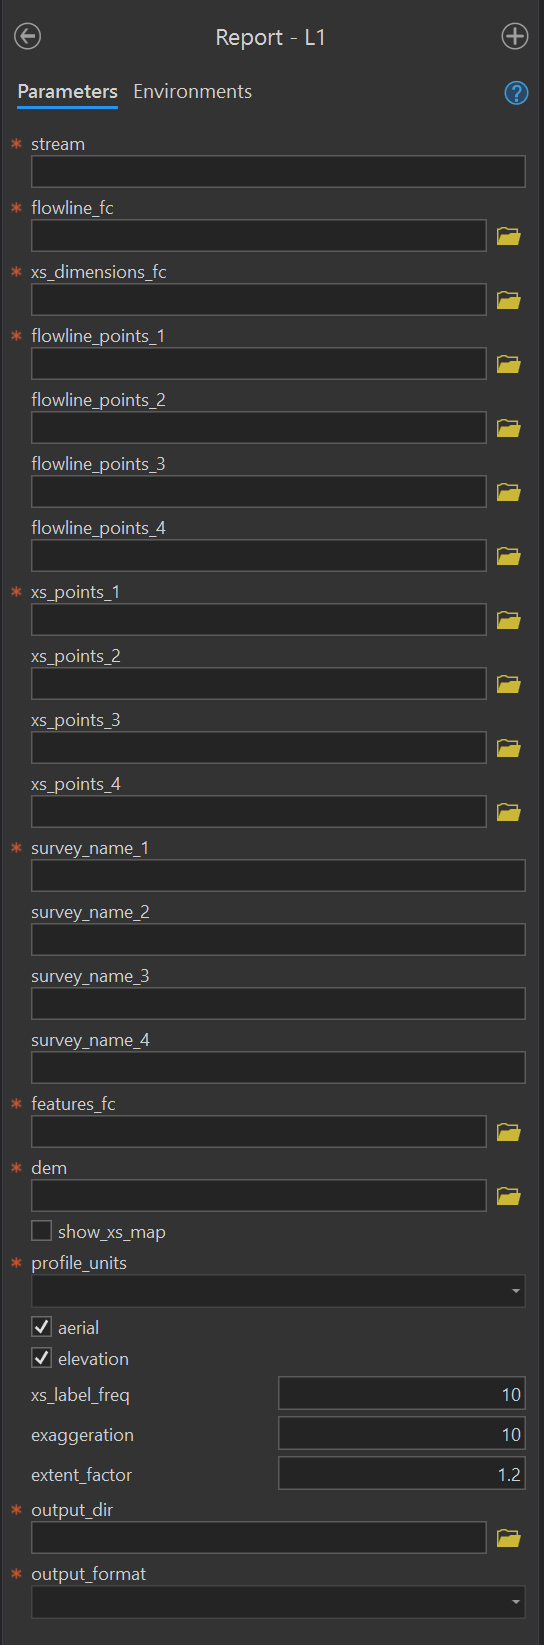
Figure 4.27: Level 1 Report.
4.3.3.5 Report - L2 Estimate Bankfull
Purpose - This tool produces the Estimate Bankfull Report using these instructions from the user manual.
Code - This ArcGIS script tool calls the R script FluvialGeomorph-toolbox/report/_Estimate_Bankfull.R.
Parameters - This tool contains the following parameters:
| Parameter | Type | Description | Required |
|---|---|---|---|
| stream | string | The name of the stream reach. | required |
| flowline_fc | Feature Class | Path to the flowline feature class. |
required |
| xs_dims_fc | Feature Class | The path to a riffle_channel_dims_L2 feature class. |
required |
| xs_points_ch_1 | Feature Class | The path to the riffle_channel_points feature class for the first time period. |
required |
| xs_points_ch_2 | Feature Class | The path to the riffle_channel_points feature class for the second time period. |
optional |
| xs_points_ch_3 | Feature Class | The path to the riffle_channel_points feature class for the third time period. |
optional |
| xs_points_ch_4 | Feature Class | The path to the riffle_channel_points feature class for the fourth time period. |
optional |
| xs_points_fp_1 | Feature Class | The path to the riffle_floodplain_points feature class for the first time period. |
required |
| xs_points_fp_2 | Feature Class | The path to the riffle_floodplain_points feature class for the second time period. |
optional |
| xs_points_fp_3 | Feature Class | The path to the riffle_floodplain_points feature class for the third time period. |
optional |
| xs_points_fp_4 | Feature Class | The path to the riffle_floodplain_points feature class for the fourth time period. |
optional |
| survey_name_1 | string | The label to use for the first survey. | required |
| survey_name_2 | string | The label to use for the second survey. | optional |
| survey_name_3 | string | The label to use for the third survey. | optional |
| survey_name_4 | string | The label to use for the fourth survey. | optional |
| features_fc | Feature Class | A stream reach features feature class. |
required |
| dem | Raster Dataset | Path to the digital elevation model (DEM). | required |
| show_xs_map | boolean | Add the cross section maps to the report? | required |
| regions | string value list | The regions that a dimension will be | required |
| from_elevation | double | The detrended elevation (in feet) to begin calculating Goodness of Fit (GOF) measures. | required |
| to_elevation | double | The detrended elevation (in feet) to end calculating Goodness of Fit (GOF) measures. | required |
| by_elevation | double | The detrended elevation (in feet) to step by for calculating Goodness of Fit (GOF) measures. | required |
| bf_estimate | double | The detrended bankfull elevation (in feet) that is used to calculate hydraulic geometry. | required |
| stat | string | The statistic to graph “RMSE,” “MAE” (the default). | required |
| label_xs | Boolean | Label cross sections? | required |
| profile_units | string | The units of the longitudinal profile. | required |
| aerial | boolean | Display an overview map with an aerial photo background? | required |
| elevation | boolean | Display an overview map with an elevation background? | required |
| xs_label_freq | double | An integer indicating the frequency of cross section labels. | required |
| exaggeration | double | The degree of terrain exaggeration. | required |
| extent_factor | double | The amount the extent is expanded around the cross section feature class. Values greater than one zoom out, values less than one zoom in. | required |
| output_dir | Folder | The path to the folder in which to write the report. | required |
| output_format | string | The file format of the report. One of “html_document,” “word_document,” “pdf_document.” | required |
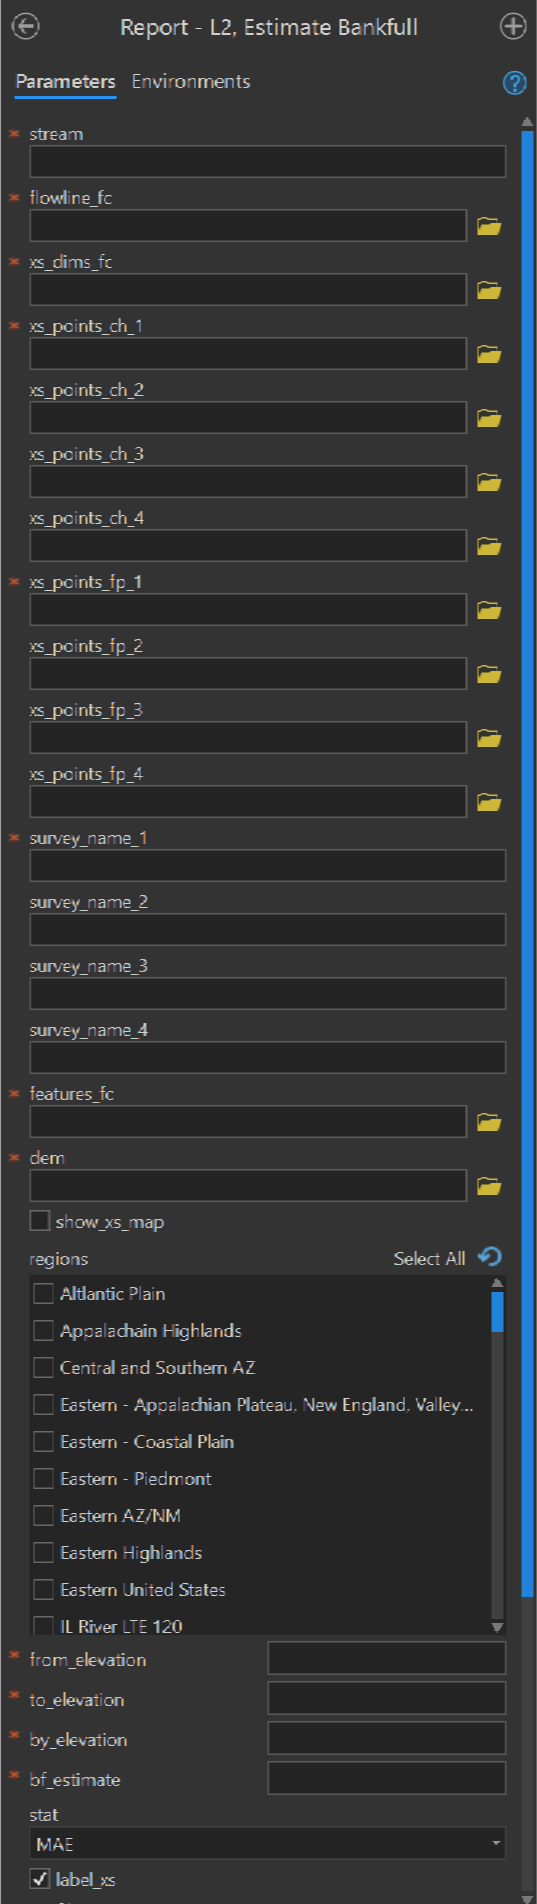
Figure 4.28: Estimate Bankfull Tool.
4.3.3.6 Report - L2
Purpose - This tool produces the Level 2 Report using these instructions from the user manual.
Code - This ArcGIS script tool calls the R script FluvialGeomorph-toolbox/report/_Level_2_Report.R which calls the R function fluvgeo::level_2_report.
Parameters - This tool contains the following parameters:
| Parameter | Type | Description | Required |
|---|---|---|---|
| stream | string | The name of the stream reach. | required |
| flowline_fc | Feature Class | Path to the flowline feature class. |
required |
| xs_dims_fc | Feature Class | The path to a riffle_channel_dims_L2 feature class. |
required |
| xs_points_1 | Feature Class | The path to a cross section points feature class for the first time period. | required |
| xs_points_2 | Feature Class | The path to a cross section points feature class for the second time period. | optional |
| xs_points_3 | Feature Class | The path to a cross section points feature class for the third time period. | optional |
| xs_points_4 | Feature Class | The path to a cross section points feature class for the fourth time period. | optional |
| survey_name_1 | string | The label to use for the first survey. | required |
| survey_name_2 | string | The label to use for the second survey. | optional |
| survey_name_3 | string | The label to use for the third survey. | optional |
| survey_name_4 | string | The label to use for the fourth survey. | optional |
| dem | Raster Dataset | Path to the digital elevation model (DEM). | required |
| banklines_fc | Feature Class | The path to the banklines feature class. | required |
| features_fc | Feature Class | A stream reach features feature class. |
required |
| bf_estimate | double | The detrended bankfull elevation (in feet) that is used to calculate hydraulic geometry. | required |
| regions | string value list | The regions that a dimension will be | required |
| label_xs | Boolean | Label cross sections? | required |
| show_xs_map | boolean | Add the cross section maps to the report? | required |
| profile_units | string | The units of the longitudinal profile. | required |
| aerial | boolean | Display an overview map with an aerial photo background? | required |
| elevation | boolean | Display an overview map with an elevation background? | required |
| xs_label_freq | double | An integer indicating the frequency of cross section labels. | required |
| exaggeration | double | The degree of terrain exaggeration. | required |
| extent_factor | double | The amount the extent is expanded around the cross section feature class. Values greater than one zoom out, values less than one zoom in. | required |
| output_dir | Folder | The path to the folder in which to write the report. | required |
| output_format | string | The file format of the report. One of “html_document,” “word_document,” “pdf_document.” | required |
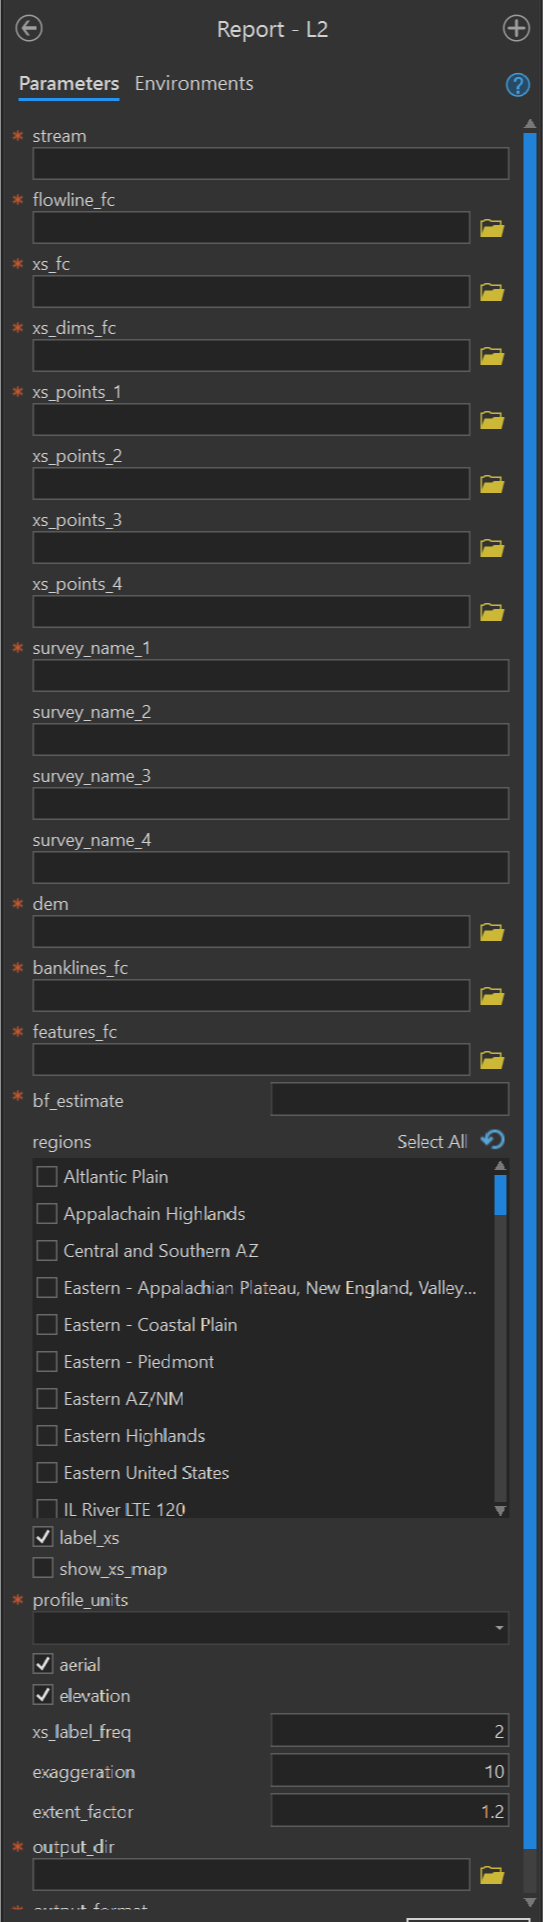
Figure 4.29: Level 2 Report.
4.3.3.7 Report - L3
Purpose - This tool produces the Level 3 Report using these instructions in the user manual.
Code - This ArcGIS script tool calls the R script FluvialGeomorph-toolbox/report/_Level_3_Report.R which called the R function fluvgeo::level_3_report.
Parameters - This tool contains the following parameters:
| Parameter | Type | Description | Required |
|---|---|---|---|
| stream | string | The name of the stream reach. | required |
| flowline_fc | Feature Class | Path to the flowline feature class. |
required |
| xs_fc | Feature Class | Path to a cross section feature class. | required |
| xs_points_1 | Feature Class | The path to a cross section points feature class for the first time period. | required |
| xs_points_2 | Feature Class | The path to a cross section points feature class for the second time period. | optional |
| xs_points_3 | Feature Class | The path to a cross section points feature class for the third time period. | optional |
| xs_points_4 | Feature Class | The path to a cross section points feature class for the fourth time period. | optional |
| survey_name_1 | string | The label to use for the first survey. | required |
| survey_name_2 | string | The label to use for the second survey. | optional |
| survey_name_3 | string | The label to use for the third survey. | optional |
| survey_name_4 | string | The label to use for the fourth survey. | optional |
| dem | Raster Dataset | Path to the digital elevation model (DEM). | required |
| banklines_fc | Feature Class | The path to the banklines feature class. | required |
| features_fc | Feature Class | A stream reach features feature class. |
required |
| bf_estimate | double | The detrended bankfull elevation (in feet) that is used to calculate hydraulic geometry. | required |
| regions | string value list | The regions that a dimension will be | required |
| label_xs | Boolean | Label cross sections? | required |
| show_xs_map | boolean | Add the cross section maps to the report? | required |
| profile_units | string | The units of the longitudinal profile. | required |
| aerial | boolean | Display an overview map with an aerial photo background? | required |
| elevation | boolean | Display an overview map with an elevation background? | required |
| xs_label_freq | double | An integer indicating the frequency of cross section labels. | required |
| exaggeration | double | The degree of terrain exaggeration. | required |
| extent_factor | double | The amount the extent is expanded around the cross section feature class. Values greater than one zoom out, values less than one zoom in. | required |
| output_dir | Folder | The path to the folder in which to write the report. | required |
| output_format | string | The file format of the report. One of “html_document,” “word_document,” “pdf_document.” | required |
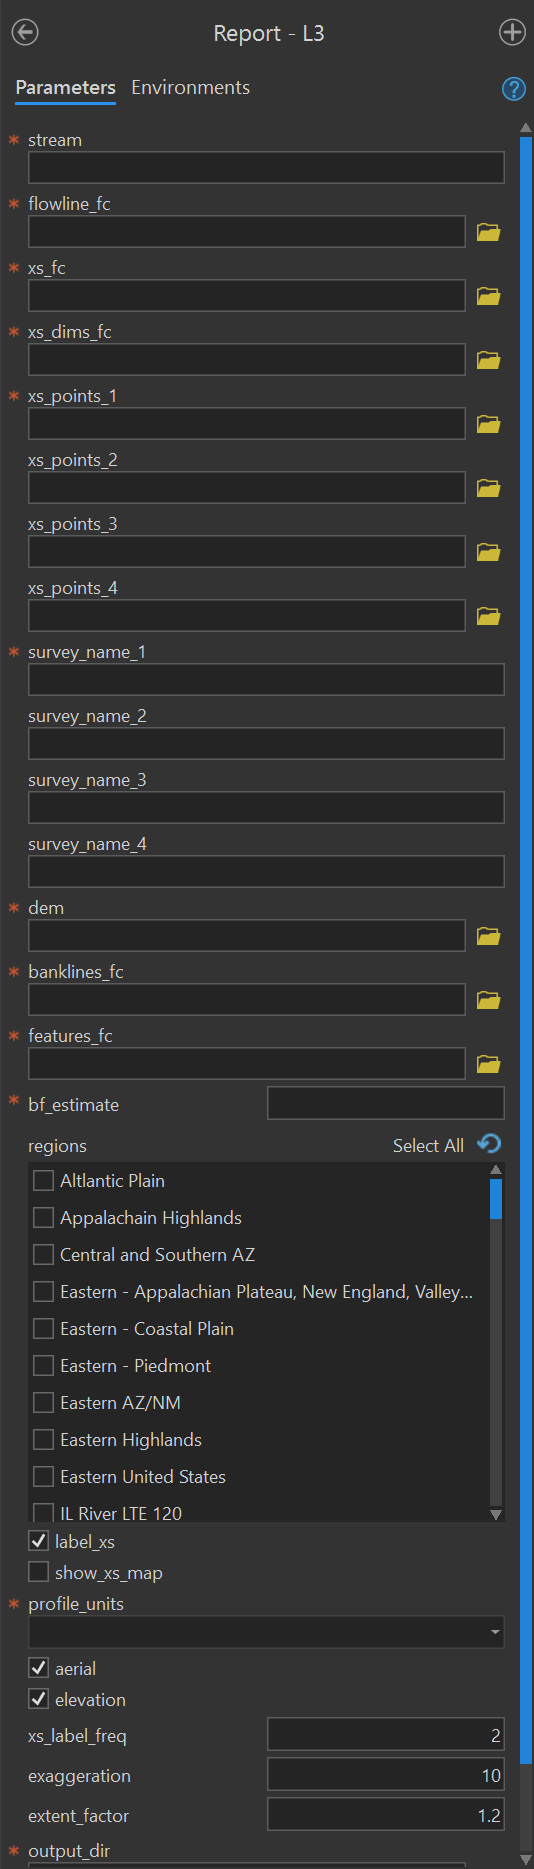
Figure 4.30: Level 3 Report.
4.3.4 04 - Symbology toolset
The purpose of this toolset is to hold the tools that standardize the symbolization of FluvialGeomorph datasets. Given the complexity of the datasets involved in this analysis, consistent symbolization improves interpretation and speeds analysis.
4.3.4.1 Banklines
Applies standard FluvialGeomorph symbology to the banklines feature class.
4.3.4.2 Contibuting Area
Applies standard FluvialGeomorph symbology to the contributing_area feature class.
4.3.4.3 Cross Section
Applies standard FluvialGeomorph symbology to the cross section feature classes (i.e., regular cross sections, riffle_floodplain and riffle_channel, and cross section dimensions).
4.3.4.4 DEM
Applies standard FluvialGeomorph symbology to the dem_hydro raster.
4.3.4.5 Features
Applies standard FluvialGeomorph symbology to the features feature class.
4.3.4.6 Flowline
Applies standard FluvialGeomorph symbology to the flowline feature class.
4.3.4.7 Flowline Points
Applies standard FluvialGeomorph symbology to the flowline_points feature class.
4.3.4.8 Loop Points
Applies standard FluvialGeomorph symbology to the loop_points feature class.
4.3.5 05 - Check toolset
The purpose of this toolset is to hold the tools used to check FluvialGeomorph features for some common, preventable errors.
4.3.5.1 Check Banklines
This ArcGIS script tool checks the banklines feature class using the R function fluvgeo::check_banklines.
4.3.5.2 Check Bankline Points
This ArcGIS script tool checks the bankline_points feature class using the R function fluvgeo::check_bankline_points.
4.3.5.3 Check Cross Section
This ArcGIS script tool checks the cross section feature classes (i.e., regular cross sections, riffle_floodplain and riffle_channel, and cross section dimensions) using the R function fluvgeo::check_cross_section.
4.3.5.4 Check Cross Section Points
This ArcGIS script tool checks the cross section points, *_points feature class using the R function fluvgeo::check_cross_section_points.
4.3.5.5 Check Features
This ArcGIS script tool checks the features feature class using the R function fluvgeo::check_cross_section_points.
4.3.5.6 Check Flowline
This ArcGIS script tool checks the flowline feature class using the R function fluvgeo::check_flowline.
4.3.5.7 Check Flowline Points
This ArcGIS script tool checks the flowline_points feature class using the R function fluvgeo::check_flowline_points.
4.3.5.8 Check Loop Points
This ArcGIS script tool checks the loop_points feature class using the R function fluvgeo::check_loop_points.
4.3.5.9 Check Valleyline
This ArcGIS script tool checks the valleyline feature class using the R function fluvgeo::check_valleyline.
4.3.6 06 - Export toolset
The purpose of this toolset is to export the tabular data from geospatial datasets for further analysis.
4.3.6.1 Level 1
This ArcGIS script tool exports the tabular data from these Level 1 feature classes: flowline_points, regular cross sections, cross section points, and features.
4.3.6.2 Level 2
4.3.6.3 Level 3
4.4 Feature Classes
FluvialGeomorph defines a standard set of feature classes that are used through the tool chain. The definition of a common set of derived features is an important step in standardizing the FluvialGeomorph workflow. These database objects form a tightly linked set of features that work together in a particular order to accomplish the analysis. They are presented here in the approximate order in which they are produced.
4.4.1 Study Area
The study_area polygon feature class is created manually by the analyst using these instructions from the user manual.
| Field Name | Type | Description | Units | Level |
|---|---|---|---|---|
| none | 1 |
4.4.2 Terrain Model Raster
The GIS analyst follows these instructions from the user manual using standard ESRI geoprocessing tools to transform a LiDAR point cloud dataset covering the study area into an appropriately resolute (pixel cell size) digital elevation model (DEM). Only points representing the ground or water surface are selected from the point cloud to derive the terrain surface DEM. This raster dataset is named dem, but can also have a suffix added to represent its year of collection in change studies. Follow these instructions from
| Field Name | Type | Description | Units | Level |
|---|---|---|---|---|
| Z | 32 bit float | The z-coordinate value (elevation). | feet, NAVD88 | 1 |
4.4.3 Cutlines
The cutlines polyline feature class is created manually by the analyst using these instructions from the user manual. The cutlines polyline feature class is used to store geometry needed to hydrologically modify a terrain model to ensure that water can accurately flow over the land surface as it does in the real world. LiDAR derived terrain models frequently contain flow blockages (e.g., road berms) that must be “cut-through” to represent the presence of flow structures (e.g., culverts, bridges) that cannot be resolved directly from the LiDAR terrain model.
| Field Name | Type | Description | Units | Level |
|---|---|---|---|---|
| none | 1 |
4.4.4 Hydro Modified Raster
Before the dem terrain model raster can be used for synthetically deriving stream features, it must first be hydrologically modified using the cutlines feature class to “burn” flow paths into the dem raster. The 02 - Hydro DEM tool creates a “hydro-enforced” DEM named dem_hydro using these instructions from the user manual.
| Field Name | Type | Description | Units | Level |
|---|---|---|---|---|
| Z | 32 bit float | The z-coordinate value (elevation). | feet, NAVD88 | 1 |
4.4.5 Contributing Area Raster
The 03 - Contributing Area tool uses the dem_hydro raster to create a contributing_area raster whose values store the drainage area upstream of each pixel using these instructions from the user manual.
| Field Name | Type | Description | Units | Level |
|---|---|---|---|---|
| contributing_area | 32 bit float | The specific catchment area. | linear units of fc | 1 |
4.4.6 Flow Accumulation Raster
The 03a - Contributing Area D8 tool is used to calculate the flow_accumulation_d8 raster whose values represent the number of upstream pixels using these instructions from the user manual.
| Field Name | Type | Description | Units | Level |
|---|
4.4.7 Flow Direction Raster
The 03a - Contributing Area D8 tool is used to calculate the flow_direction_d8 raster whose values represent the direction of flow across each pixel using these instructions from the user manual.
| Field Name | Type | Description | Units | Level |
|---|---|---|---|---|
| flow_direction_d8 | 32 bit float | The direction of flow from each cell to its downslope neighbor. | D8 flow direction | 1 |
4.4.8 Stream Network
The 04 - Stream Network tool uses the contributing_area raster to derive a synthetic stream_network polyline feature class representing the stream network of the study area using these instructions from the user manual.
| Field Name | Type | Description | Units | Level |
|---|---|---|---|---|
| ReachName | text | Name of the reach. | 1 |
4.4.9 Stream Network Points
The 04a - Stream Network Points tool creates the stream_network_points point feature class to represent regularly spaced points along a stream_network feature class using these instructions from the user manual. These stream_network_points features are used to store elevation and route position (longitudinal stream stationing) information for a stream_network feature.
| Field Name | Type | Description | Units | Level |
|---|---|---|---|---|
| ReachName | text | Name of the reach. | 1 | |
| POINT_X | double | The x-coordinate value (longitude). | linear units of fc | 1 |
| POINT_Y | double | The y-coordinate value (latitude). | linear units of fc | 1 |
| POINT_M | double | The m-coordinate value (route position). | linear units of fc | 1 |
| Watershed_Area_SqMile | double | The upstream watershed drainage area. | square miles | 1 |
| Z | double | The z-coordinate value (elevation). | feet, NAVD88 | 1 |
4.4.10 Gradient
The 04b - Slope and Sinuosity tool creates the gradient_* point feature class that calculates slope and sinuosity for a stream_network_points point feature class using these instructions in the user manual. The gradient_* point feature class is named using the moving window size specified.
| Field Name | Type | Description | Units | Level |
|---|---|---|---|---|
| ReachName | text | Name of the reach. | 1 | |
| POINT_X | double | The x-coordinate value (longitude). | linear units of fc | 1 |
| POINT_Y | double | The y-coordinate value (latitude). | linear units of fc | 1 |
| POINT_M | double | The m-coordinate value (route position). | linear units of fc | 1 |
| Z | double | The z-coordinate value (elevation). | feet, NAVD88 | 1 |
| z_smooth | double | The smoothed z-coordinate value (elevation). | feet, NAVD88 | 1 |
| upstream_x | double | The x-coordinate value (longitude) of the next upsteam point in the moving window. | linear units of fc | 1 |
| upstream_y | double | The y-coordinate value (latitude) of the next upsteam point in the moving window. | linear units of fc | 1 |
| downstream_x | double | The x-coordinate value (longitude) of the next downsteam point in the moving window. | linear units of fc | 1 |
| downstream_y | double | The y-coordinate value (latitude) of the next downsteam point in the moving window. | linear units of fc | 1 |
| upstream_z | double | The z-coordinate value (elevation) of the next upstream point in the moving window. | feet, NAVD88 | 1 |
| downstream_z | double | The z-coordinate value (elevation) of the next downstream point in the moving window. | feet, NAVD88 | 1 |
| upstream_m | double | The m-coordinate value (route position) of the next upstream point in the moving window. | linear units of fc | 1 |
| downstream_m | double | The m-coordinate value (route position) of the next downstreampoint in the moving window. | linear units of fc | 1 |
| rise | double | The elevation difference between the downstream and upstream point in the moving window. | feet | 1 |
| run | double | The longitudinal distance along the stream network between the downstream and upstream point in the moving window. | feet | 1 |
| stream_length | double | The longitudinal distance along the stream network between the downstream and upstream point in the moving window. | feet | 1 |
| valley_length | double | The longitudinal distance along the valleyline between the downstream and upstream stream network point in the moving window. | feet | 1 |
| sinuosity | double | The sinuosity of the stream within the moving window (valley_length/stream_length). | 1 | |
| sinuosity_gte_one | double | The sinuosity metric, values greater than or equal to one. | 1 | |
| slope | double | The slope of the stream within the moving window (rise/run). | degree | 1 |
| slope_gte_zero | double | The slope metric, values greater than of equal to zero. | degree | 1 |
4.4.11 Watershed Points
The watershed_points feature class is manually created by the analyst using the stream_network_points feature class following these instructions from the user manual. The watershed_points point feature class is used to represent the downstream location of watersheds whose areal extent is to be calculated. These single points are sometimes referred to as “pour points” located along a stream network.
| Field Name | Type | Description | Units | Level |
|---|---|---|---|---|
| ReachName | text | Name of the reach. | 1 | |
| POINT_X | double | The x-coordinate value (longitude). | linear units of fc | 1 |
| POINT_Y | double | The y-coordinate value (latitude). | linear units of fc | 1 |
| POINT_M | double | The m-coordinate value (route position). | linear units of fc | 1 |
| Watershed_Area_SqMile | double | The upstream watershed drainage area. | square miles | 1 |
| Z | double | The z-coordinate value (elevation). | feet, NAVD88 | 1 |
4.4.12 Watershed
The 04c - Watershed tool creates the watershed polygon feature class and represent the drainage area upstream of a single point (aka “pour point”) located along a stream network. All pixels within each watershed polygon feature flow to the stream network point used to derive the watershed using these instructions from the user manual.
| Field Name | Type | Description | Units | Level |
|---|---|---|---|---|
| ReachName | text | Name of the reach. | 1 | |
| Shape_Area | double | The area of the watershed. | linear units of fc | 1 |
4.4.13 Flowline
The 05 - Flowline tool creates the flowline polyline feature class and is used to represent the likely flow path of a stream reach within a study area using these instructions from the user manual. This is the primary flow path feature used in the FluvialGeomorph toolbox. Since non-bathymetric LiDAR is often used to derive flowline features, this should not be interpreted as the thalweg when water is present in the DEM.
| Field Name | Type | Description | Units | Level |
|---|---|---|---|---|
| ReachName | text | Name of the reach. | 1 | |
| from_measure | double | The start longitudinal stationing value for the reach. | kilometers | 1 |
| to_measure | double | The end longitudinal stationing value for the reach. | kilometers | 1 |
4.4.14 Flowline Points
The 06 - Flowline Points tool creates the flowline_points point feature class and is used to represent regularly spaced points along a flowline feature class using these instructions from the user manual. These flowline_points features are used to store elevation and route position (longitudinal stream stationing) information for a flowline feature. flowline_points are used to calculate a series of stream longitudinal dimensions.
| Field Name | Type | Description | Units | Level |
|---|---|---|---|---|
| ReachName | text | Name of the reach. | 1 | |
| POINT_X | double | The x-coordinate value (longitude). | linear units of fc | 1 |
| POINT_Y | double | The y-coordinate value (latitude). | linear units of fc | 1 |
| POINT_M | double | The m-coordinate value (route position). | 1 | |
| Z | double | The z-coordinate value (elevation). | feet, NAVD88 | 1 |
4.4.15 Detrended Raster
The 07 - Detrend DEM tool creates the detrend raster dataset using these instruction from the user manual. The detrend raster is an elevation model where the downstream slope of the dem_hydro has been removed.
| Field Name | Type | Description | Units | Level |
|---|---|---|---|---|
| detrend_Z | 32 bit float | The detrended z-coordinate value (elevation). | feet, detrended | 1 |
4.4.16 Channel Slope Raster
The 09 - Channel Slope tool creates the channel_slope raster using these instructions from the user manual. The channel_slope raster represents the slope of the dem_hydro within the channel. This is not to be confused with the longitudinal slope of the stream reach, but is the pixel-wise, raster surface slope of the channel area.
| Field Name | Type | Description | Units | Level |
|---|---|---|---|---|
| slope | 32 bit float | The terrain slope. | degree | 1 |
4.4.17 Centerline
The 10 - Centerline tool creates the centerline polyline feature class using these instructions from the user manual. The centerline polyline feature class is used to represent a stream flow path that falls roughly equidistant between the banklines at bankfull water surface elevation.
| Field Name | Type | Description | Units | Level |
|---|---|---|---|---|
| none | 2 |
4.4.18 Regular Cross Sections
The 11 - XS Layout tool is used to create a regularly spaced cross section xs_* polyline feature class using these instructions from the user manual. Cross sections are polyline feature classes drawn perpendicular to the flowline feature and are long enough to extend across some portion of the channel and floodplain. Cross section features are used to define channel cross section dimensions. Regular cross sections are spaced equal distances longitudinally along the flowline. Regularly spaced cross sections are used to sample conditions within a stream reach to display a continuous series of values and calculate aggregate stream values.
| Field Name | Type | Description | Units | Level |
|---|---|---|---|---|
| ReachName | text | Name of the reach. | 1 | |
| Seq | short | The cross section unique identifier. | 1 | |
| x_start | double | The x-coordinate value at the start of the cross section. | linear units of fc | 1 |
| y_start | double | The y-coordinate value at the start of the cross section. | linear units of fc | 1 |
| x_end | double | The x-coordinate value at the end of the cross section. | linear units of fc | 1 |
| y_end | double | The y-coordinate value at the end of the cross section. | linear units of fc | 1 |
| Watershed_Area_SqMile | double | The upstream watershed drainage area. | square miles | 1 |
| from_measure | double | The start longitudinal stationing value for the reach. | kilometers | 1 |
| to_measure | double | The end longitudinal stationing value for the reach. | kilometers | 1 |
| POINT_X | double | The x-coordinate value (longitude). | linear units of fc | 1 |
| POINT_Y | double | The y-coordinate value (latitude). | linear units of fc | 1 |
| POINT_M | double | The m-coordinate value (route position). | linear units of fc | 1 |
| Z | double | The z-coordinate value (elevation). | feet, NAVD88 | 1 |
| km_to_mouth | double | The distance to the mouth of the site. | kilometers | 1 |
| loop | long | The loop number. | 3 | |
| bend | long | The bend number. | 3 |
4.4.19 Riffle Cross Sections
Riffle cross sections (i.e., riffle_floodplain, riffle_channel) are a unique type of cross section manually drawn by the analyst within a riffle stream feature using these instructions from the user manual. In contrast to regularly spaced cross sections that are delineated by a script, riffles irregularly spaced along a stream and are manually drawn by a GIS analyst. Analysts are trained to identify riffles using a set of guidelines from the literature and interpretation of the DEM and aerial imagery. The riffle_floodplain polyline feature class is drawn longitudinally within riffle features and extend laterally across the active floodplain. The riffle_channel polyline feature class is also drawn longitudinally within riffle features, but only extend laterally across the bankfull channel area.
| Field Name | Type | Description | Units | Level |
|---|---|---|---|---|
| ReachName | text | Name of the reach. | 2 | |
| Seq | short | The cross section unique identifier. | 2 | |
| Watershed_Area_SqMile | double | The upstream watershed drainage area. | square miles | 2 |
| from_measure | double | The start longitudinal stationing value for the reach. | kilometers | 2 |
| to_measure | double | The end longitudinal stationing value for the reach. | kilometers | 2 |
| POINT_X | double | The x-coordinate value (longitude). | linear units of fc | 2 |
| POINT_Y | double | The y-coordinate value (latitude). | linear units of fc | 2 |
| POINT_M | double | The m-coordinate value (route position). | linear units of fc | 2 |
| Z | double | The z-coordinate value (elevation). | feet, NAVD88 | 2 |
| km_to_mouth | double | The distance to the mouth of the site. | kilometers | 2 |
| loop | long | The loop number. | 3 | |
| bend | long | The bend number. | 3 |
4.4.20 Cross Section Points
The 14 - XS Points tool creates the *_points points feature class using these instructions from the user manual for Level 1 and Level 2. Cross sections polyline feature classes (i.e., regularly spaced cross sections and riffle cross sections: riffle_floodplain, riffle_channel) can be converted to a set of regularly spaced points along the cross section. These points are used to store elevation and route position (lateral stream stationing) information for a cross section feature class. Cross section points are used to calculate a series of cross section dimensions.
| Field Name | Type | Description | Units | Level |
|---|---|---|---|---|
| ReachName | text | Name of the reach. | 1,2 | |
| Seq | short | The cross section unique identifier. | 1,2 | |
| Watershed_Area_SqMile | double | The upstream watershed drainage area. | square miles | 1,2 |
| from_measure | double | The start longitudinal stationing value for the reach. | kilometers | 1,2 |
| to_measure | double | The end longitudinal stationing value for the reach. | kilometers | 1,2 |
| POINT_X | double | The x-coordinate value (longitude). | linear units of fc | 1,2 |
| POINT_Y | double | The y-coordinate value (latitude). | linear units of fc | 1,2 |
| POINT_M | double | The m-coordinate value (route position). | linear units of fc | 1,2 |
| POINT_M_units | text | The units of the POINT_M field. | 1,2 | |
| km_to_mouth | double | The distance to the mouth of the site. | kilometers | 1,2 |
| DEM_Z | double | The z-coordinate value (elevation). | feet, NAVD88 | 1,2 |
| dem_units | double | The units of theDEM_Z field. | 1,2 | |
| Detrend_DEM_Z | double | The z-coordinate value on the detrended raster. | feet, detrended | 1,2 |
| loop | long | The loop number. | 3 | |
| bend | long | The bend number. | 3 |
4.4.21 Cross Section Dimensions
Cross section dimension polyline feature classes are used to store the hydraulic dimensions calculated for each cross section. Since the FluvialGeomorph workflow is divided into three levels, cross section dimensions are calculated at each level. Each level allows for an increasingly complex set of dimensions to be calculated, with each level building on the complexity of the previous level. There are three cross section dimension feature classes, one for each level *_dims_L1, *_dims_L2, and *_dims_L3. Cross section dimensions are calculated using the following tools:
- Level 1 Dimensions - The
15a XS Dimensions, Level 1tool creates the*_dims_L1feature class using these instructions from the user manual. - Level 2 Dimensions - The
15b XS Dimensions, Level 2tool creates the*_dims_L2feature class using these instructions from the user manual for L2 Initial and L2 Final. - Level 3 Dimensions - The
15c XS Planform, Level 3tool creates the*_dims_L3feature class using these instructions from the user manual.
Cross section dimensions can be calculated for the various types of cross sections (regular cross sections or riffle cross sections). The name of the cross section feature for which dimensions were calculated is prepended to the output dimension feature class. Metrics calculated at previous levels are included in the attribute table of each dimension feature class. Therefore, to avoid repetition only the new fields calculated at each level are included in the tables of fields in this section. The attributes of the original cross section feature class are also omitted since they depend on the cross section type used.
| Field Name | Type | Description | Units | Level |
|---|---|---|---|---|
| z_smooth | double | The smoothed z-coordinate value (elevation). | feet, NAVD88 | 1 |
| upstream_x | double | The x-coordinate value (longitude) of the next upsteam cross section in the moving window. | linear units of fc | 1 |
| upstream_y | double | The y-coordinate value (latitude) of the next upsteam cross section in the moving window. | linear units of fc | 1 |
| downstream_x | double | The x-coordinate value (longitude) of the next downsteam cross section in the moving window. | linear units of fc | 1 |
| downstream_y | double | The y-coordinate value (latitude) of the next downsteam cross section in the moving window. | linear units of fc | 1 |
| upstream_z | double | The z-coordinate value (elevation) of the next upstream cross section in the moving window. | feet, NAVD88 | 1 |
| downstream_z | double | The z-coordinate value (elevation) of the next downstream cross section in the moving window. | feet, NAVD88 | 1 |
| upstream_m | double | The m-coordinate value (route position) of the next upstream cross section in the moving window. | linear units of fc | 1 |
| downstream_m | double | The m-coordinate value (route position) of the next downstream cross section in the moving window. | linear units of fc | 1 |
| rise | double | The elevation difference between the downstream and upstream cross section in the moving window. | feet | 1 |
| run | double | The longitudinal distance along the flowline between the downstream and upstream cross sections in the moving window. | feet | 1 |
| stream_length | double | The longitudinal distance along the flowline between the downstream and upstream cross sections in the moving window. | feet | 1 |
| valley_length | double | The longitudinal distance along the valleyline between the downstream and upstream cross sections in the moving window. | feet | 1 |
| sinuosity | double | The sinuosity of the stream within the moving window (valley_length/stream_length). | 1 | |
| sinuosity_gte_one | double | The sinuosity metric, values greater than or equal to one. | 1 | |
| slope | double | The slope of the stream within the moving window (rise/run). | degree | 1 |
| slope_gte_zero | double | The slope metric, values greater than of equal to zero. | degree | 1 |
| Field Name | Type | Description | Units | Level |
|---|---|---|---|---|
| bankfull_elevation | double | The detrended elevation of the water surface at bankfull discharge. | feet, detrended | 2 |
| drainage_area | double | The upstream watershed drainage area. | square miles | 2 |
| xs_area | double | The cross sectional area at the estimated bankfull water surface elevation. | square feet | 2 |
| xs_width | double | The cross section width at the estimated bankfull water surface elevation. | square feet | 2 |
| xs_depth | double | The cross section depth at the estimated bankfull water surface elevation. | square feet | 2 |
| discharge | double | The stream discharge. | cubic m/s | 2 |
| fp_area | double | The cross sectional area at the estimated floodprone water surface elevation. | square feet | 2 |
| fp_width | double | The cross section width at the estimated floodprone water surface elevation. | feet | 2 |
| fp_depth | double | The cross sectional depth at the estimated floodprone water surface elevation. | feet | 2 |
| xs_width_depth_ratio | double | The width to depth ratio. | 2 | |
| xs_width_depth_ratio_gte_one | double | The width to depth ratio metric, gteater than or equal to one. | 2 | |
| xs_entrenchment_ratio | double | The entrenchment ratio. | 2 | |
| xs_entrenchment_ratio_gte_one | double | The entrenchment ratio metric, greater than or equal to one. | 2 | |
| watersurface_elev | double | The as-measured water surface elevation. | feet, NAVD88 | 2 |
| bankfull_elev | double | The estimated bankfull water surface elevation. | feet, NAVD88 | 2 |
| floodprone_elev | double | The estimated floodprone water surface elevation. | feet, NAVD88 | 2 |
| xs_mean_depth | double | The cross section mean depth at the estimated bankfull water surface elevation. | feet | 2 |
| shear_stress_density | double | The fluid shear stress, calculated using the density of water. | kg/m^2 | 2 |
| shear_stress_density_gte_zero | double | The fluid shear stress density metric, greater than or equal to zero. | kg/m^2 | 2 |
| shear_stress_weight | double | The fluid shear stress, calculated using the specific weight of water. | lb/ft^2 | 2 |
| shear_stress_weight_gte_zero | double | The fluid shear stress specific weight metric, greater than or equal to zero. | lb/ft^2 | 2 |
| shear_stress_lane | double | The fluid shear stress, calculated using the Lane’s Balance method. | 2 | |
| shear_stress_lane_gte_zero | double | The fluid shear stress Lane’s metric, greater than or equal to zero. | 2 | |
| unit_stream_power | double | The unit stream power. | kg/m/s | 2 |
| unit_stream_power_gte_zero | double | The unit stream power metric, greater than or equal to zero. | kg/m/s | 2 |
| Field Name | Type | Description | Units | Level |
|---|---|---|---|---|
| bend_num | double | The bend number. | 3 | |
| bend_POINT_X | double | The x-coordinate value (longitude) of the center of the bend. | linear units of fc | 3 |
| bend_POINT_Y | double | The y-coordinate value (latitude) of the center of the bend. | linear units of fc | 3 |
| loop_POINT_X | double | The x-coordinate value (longitude) of the center of the loop. | linear units of fc | 3 |
| loop_POINT_Y | double | The y-coordinate value (latitude) of the center of the loop. | linear units of fc | 3 |
| bend_radius | double | The radius of the bend. | linear units of fc | 3 |
| meander_length | double | The meander length. | feet | 3 |
| meander_width | double | The meander width. | feet | 3 |
| rc_bfw_ratio | double | The radius of curvature to bankfull width ratio. | 3 | |
| rc_bfw_ratio_lte_30 | double | The radius of curvature to bankfull width ratio less than or equale to 30. | 3 | |
| mbw_bfw_ratio | double | The meander bend width to bankfull width ratio. | 3 | |
| mbw_bfw_ratio_lte_30 | double | The meander bend width to bankfull width ratio less than or equal to 30. | 3 |
4.4.22 Bankfull Area
The 08 - Water Surface Extent tool is used to create the bankfull_area polygon feature class using these instructions from the user manual. The bankfull_area polygon feature class represents the channel area typically inundated during bankfull events. The detrend raster dataset is used to interactively “flood” the channel to define this extent.
| Field Name | Type | Description | Units | Level |
|---|---|---|---|---|
| Id | long | The polygon unique identifier. | 2 | |
| gridcode | long | Indicates if a polygon is innundated at the specified detrended elevation (1 = innundated, 0 = not innundated). | 2 | |
| Shape_Area | double | Area of the polygon. | linear units of fc | 2 |
4.4.23 Banklines
The banklines feature class is manually created from the bankfull_area using these instructions from the user manual. The banklines polyline feature class represents the stream banks at bankfull. The edge of the bankfull_area polygon features are used to create to banklines, one representing the left descending bank and another the right descending bank.
| Field Name | Type | Description | Units | Level |
|---|---|---|---|---|
| ReachName | text | Name of the reach. | 2 | |
| bank_id | long | Bankline numeric unique identifier. | 2 | |
| bank | text | Bankline text unique identifier (one of “left descending” or “right descending”). | 2 | |
| from_measure | double | The start longitudinal stationing value for the bankline. | 2 | |
| to_measure | double | The end longitudinal stationing value for the bankline. | 2 |
4.4.24 Bankline Points
The 14b - Bankline Points tool creates the bankline_points point feature class using these instructions in the user manual. The bankline_points point feature class is a set of regularly spaced point features located along each banklines feature. These points are used to store elevation and route position (longitudinal bankline stationing) information for each bankline.
| Field Name | Type | Description | Units | Level |
|---|---|---|---|---|
| ReachName | text | Name of the reach. | 3 | |
| bank_id | long | Bankline numeric unique identifier. | 3 | |
| bank | text | Bankline text unique identifier (one of “left descending” or “right descending”). | 3 | |
| bank_POINT_X | double | The x-coordinate value (longitude) of the bankline point. | linear units of fc | 3 |
| bank_POINT_Y | double | The y-coordinate value (latitude) of the bankline point. | linear units of fc | 3 |
| bank_POINT_M | double | The m-coordinate value (route position) of the bankline point. | linear units of fc | 3 |
| DEM_Z | double | The z-coordinate value (elevation) of the bankline point. | feet, NAVD88 | 3 |
| loop | long | The loop number. | 3 | |
| bend | long | The bend number. | 3 | |
| position | text | The planform location indicator. Indicates if a bankline point represents the “start” of a loop bend, the “end” of a loop bend, or the “apex” of a loop. | 3 | |
| valley_POINT_X | double | The x-coordinate value (longitude) of the closest point on the valley line. | linear units of fc | 3 |
| valley_POINT_Y | double | The y-coordinate value (latitude) of the closest point on the valley line. | linear units of fc | 3 |
| valley_POINT_M | double | The m-coordinate value (route position) of the closest point on the valley line. | linear units of fc | 3 |
4.4.25 Valleyline
The valleyline is created using these instructions from the user manual. The valleyline polyline feature class represents the trend line of the down-valley axis. It bisects stream meanders as the stream swings from side to side across its floodplain.
| Field Name | Type | Description | Units | Level |
|---|---|---|---|---|
| ReachName | text | Name of the reach. | 3 | |
| from_measure | double | The start longitudinal stationing value for the reach. | kilometers | 3 |
| to_measure | double | The end longitudinal stationing value for the reach. | kilometers | 3 |
4.4.26 Loop Points
The loop_points point feature class is manually created by the analyst using these instructions from the user manual. The loop_points point feature class is used to store the longitudinal extents of loops and bends used for planform analysis. Within the FluvialGeomorph toolbox, the term “loop” is defined as a single meander as it swings across the valleyline. Moving downstream along a single loop, once the stream swings substantially across the valleyline, another loop begins. The point of maximum distance of a flowline from the valeyline (laterally across the floodplain) defines a loop “apex.” Moving to a finer scale, “bends” are defined as stream undulations within a particular loop. Therefore, a single loop may contain many bends. These loop and bend extents and loop apices are used to calculate a set of planform dimensions.
| Field Name | Type | Description | Units | Level |
|---|---|---|---|---|
| ReachName | text | Name of the reach. | 3 | |
| loop | long | The loop number. | 3 | |
| bend | long | The bend number. | 3 | |
| position | text | The planform location indicator. Indicates if a bankline point represents the “start” of a loop bend, the “end” of a loop bend, or the “apex” of a loop. | 3 |
4.4.27 Features
The features point feature class is created manually by the analyst using these instructions in the user manual. The features point feature class is used to identify and label key stream features and their longitudinal position. Instances of features typically include relevant tributaries, localities, and infrastructure built within the floodplain affecting flow.
| Field Name | Type | Description | Units | Level |
|---|---|---|---|---|
| Name | text | Name of the stream feature. | 1 | |
| km_to_mouth | double | The distance to the mouth of the site. | kilometers | 1 |
4.5 Reports
FluvialGeomorph produces a series of reports that help to define stream conditions.
4.5.1 Graph - Longitudinal Profile Compare
This graph is produced using the Graph - Longitudinal Profile Compare tool.
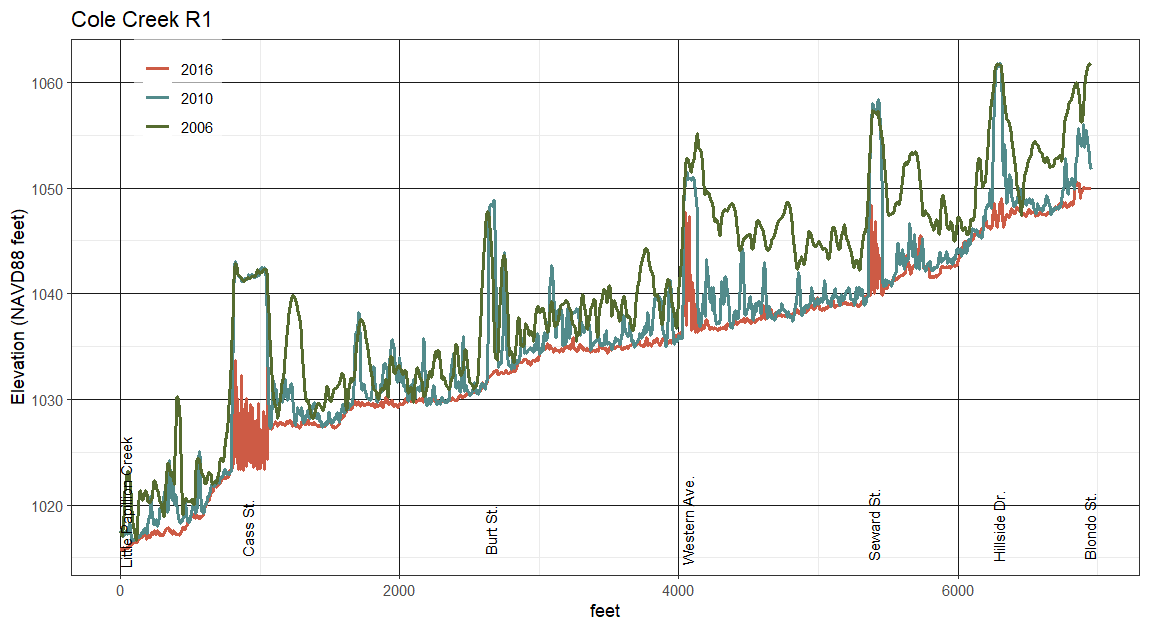
Figure 4.31: Longitudinal Profile Plot.
4.5.2 Report - L1
Purpose - The Level 1 Report contains a set of maps and graphs that describe the channel as measured from the LiDAR derived DEM. This report is produced using the Report - L1 tool using these instructions from the user manual.
Code - This report is created by the R Markdown parameterized report in the R package fluvgeo/reports/level_1_report.Rmd.
This report contains the following sections:
- Study Area Overview - This section provides an overview of the study area reach.
- Reach Overview Map - A reach overview map displaying cross section locations over an aerial image and/or a medium resolution DEM with multi-direction shaded relief. This figure is produced by the R function
fluvgeo::map_reach_overview.
- Reach Overview Map - A reach overview map displaying cross section locations over an aerial image and/or a medium resolution DEM with multi-direction shaded relief. This figure is produced by the R function
- Longitudinal Profile - This section displays the elevation (y-axis) of the stream reach along its length (x-axis) beginning from the downstream end of the reach moving upstream (typically referred to as a longitudinal profile).
- Longitudinal Profile - This longitudinal profile graph is created from the
flowline_pointsfeature class for several surveys if available. This figure is produced by the R functionfluvgeo::compare_long_profile.R.
- XS Longitudinal Profile - This longitudinal profile graph is created using a regular cross sections feature class. This figure is produced by the R function
fluvgeo::compare_xs_long_profile.
- Longitudinal Profile - This longitudinal profile graph is created from the
- Cross Section Metrics - This section displays metrics for the cross sections of a stream reach.
- Cross Section Metrics Plot, Level 1 - This stream reach metrics graph displays the Level 1 metrics on a faceted graph. This figure is produced by the R function
fluvgeo::xs_metrics_plot_L1.
- Cross Section Metrics Plot, Level 1 - This stream reach metrics graph displays the Level 1 metrics on a faceted graph. This figure is produced by the R function
- Cross Section Profiles - This section displays a focused view of the characteristics of each individual cross section in the stream reach.
- Cross Section Map - This map displays the extent of a single cross section in plan view with a DEM background. This figure is produced by the R function
fluvgeo::map_xs. - Cross Section Profile Compare Plot - This graph displays a single regularly spaced cross section in profile view comparing the elevations from multiple surveys if provided. This figure is produced by the R function
fluvgeo::xs_compare_plot_L1.
- Cross Section Map - This map displays the extent of a single cross section in plan view with a DEM background. This figure is produced by the R function
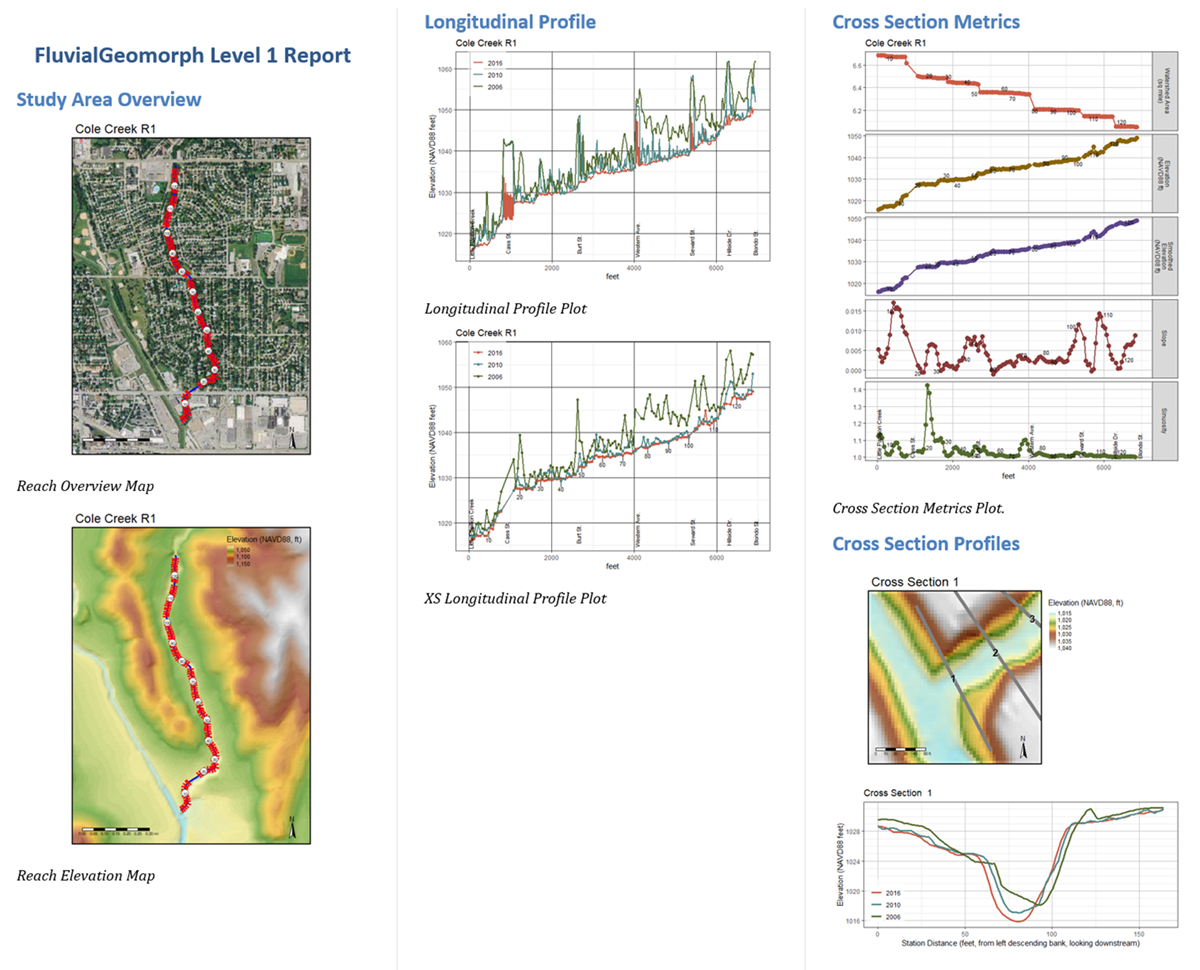
Figure 4.32: Level 1 Report.
4.5.3 Report - L2 Estimate Bankfull
Purpose - The Estimate Bankfull Report is used to help estimate the bankfull water surface elevation for an ungaged stream with the assistance of regional curves and visual observation of geomorphic indicators from LiDAR surveys. This report is produced using the Report - L2 Estimate Bankfull tool using these instructions from the user manual.
Code - This report is created by the R Markdown parameterized report in the R package fluvgeo/reports/estimate_bankfull_report.Rmd.
This report contains the follow sections:
- Study Area Overview - This section provides an overview of the study area reach.
- Reach Overview Map - A reach overview map displaying cross section locations over an aerial image and/or a medium resolution DEM with multi-direction shaded relief. This figure is produced by the R function
fluvgeo::map_reach_overview.
- Reach Overview Map - A reach overview map displaying cross section locations over an aerial image and/or a medium resolution DEM with multi-direction shaded relief. This figure is produced by the R function
- Bankfull Elevation Sensitivity Analysis - This section performs a sensitivity analysis of the directly measured reach-wide channel dimensions compared to the regional curve estimated channel dimensions.
- Bankfull Elevation Goodness of Fit Graph - This graph is used to identify how similar this reach’s dimensions are compared to dimensions from several other regions at the current bankfull estimate. This figure is produced by the R function
fluvgeo::gof_graph. - Bankfull Elevation Dimensions by Region Table - This table summarizes this reach’s dimensions compared to several other regions at the current bankfull elevation. This table is created by code in the Estimate Bankfull Report,
fluvgeo/reports/estimate_bankfull_report.Rmd - Regional Hydraulic Geometry Curves Graph - This graph displays the channel dimensions of each cross section in the reach, along with the regional curve estimated dimensions. This figure is produced by the R function
fluvgeo::reach_rhg_graph.
- Bankfull Elevation Goodness of Fit Graph - This graph is used to identify how similar this reach’s dimensions are compared to dimensions from several other regions at the current bankfull estimate. This figure is produced by the R function
- Longitudinal Profile - This section displays the elevation (y-axis) of the stream reach along its length (x-axis) beginning from the downstream end of the reach moving upstream (typically referred to as a longitudinal profile).
- XS Longitudinal Profile - This longitudinal profile graph is created using a
riffle_channelfeature class for the survey used to generate the bankfull estimate. This figure is produced by the R functionfluvgeo::xs_profile_plot.
- XS Longitudinal Profile - This longitudinal profile graph is created using a
- Cross Section Metrics - This section displays metrics the Level 2 metrics for the riffle cross sections of a stream reach.
- Cross Section Metrics Plot, Level 2 - This stream reach metrics graph displays the Level 2 metrics on a faceted graph. This figure is produced by the R function
fluvgeo::xs_metrics_plot_L2.
- Cross Section Metrics Plot, Level 2 - This stream reach metrics graph displays the Level 2 metrics on a faceted graph. This figure is produced by the R function
- Cross Section Profiles - This section displays a focused view of the characteristics of each individual cross section in the stream reach.
- Cross Section Map - This map displays the extent of a single cross section in plan view with a high resolution DEM background. This figure is produced by the R function
fluvgeo::map_xs. - Floodplain XS Profile Compare Plot - This graph displays a single
riffle_floodplainfeature in a wide aspect ratio profile view to compare the elevations from multiple surveys if provided. This figure is produced by the R functionfluvgeo::xs_compare_plot_L2. - Channel XS Profile Compare Plot - This graph displays a single
riffle_channelfeature in a square aspect ratio profile view to compare the elevations from multiple surveys if provided. This figure is produced by the R functionfluvgeo::xs_compare_plot_L2. - Bankfull Elevation Dimensions by Region Table - This table summarizes this cross section’s dimensions compared to several other regions at the current bankfull elevation. This table is created by code in the Estimate Bankfull Report,
fluvgeo/reports/estimate_bankfull_report.Rmd.
- Cross Section Map - This map displays the extent of a single cross section in plan view with a high resolution DEM background. This figure is produced by the R function
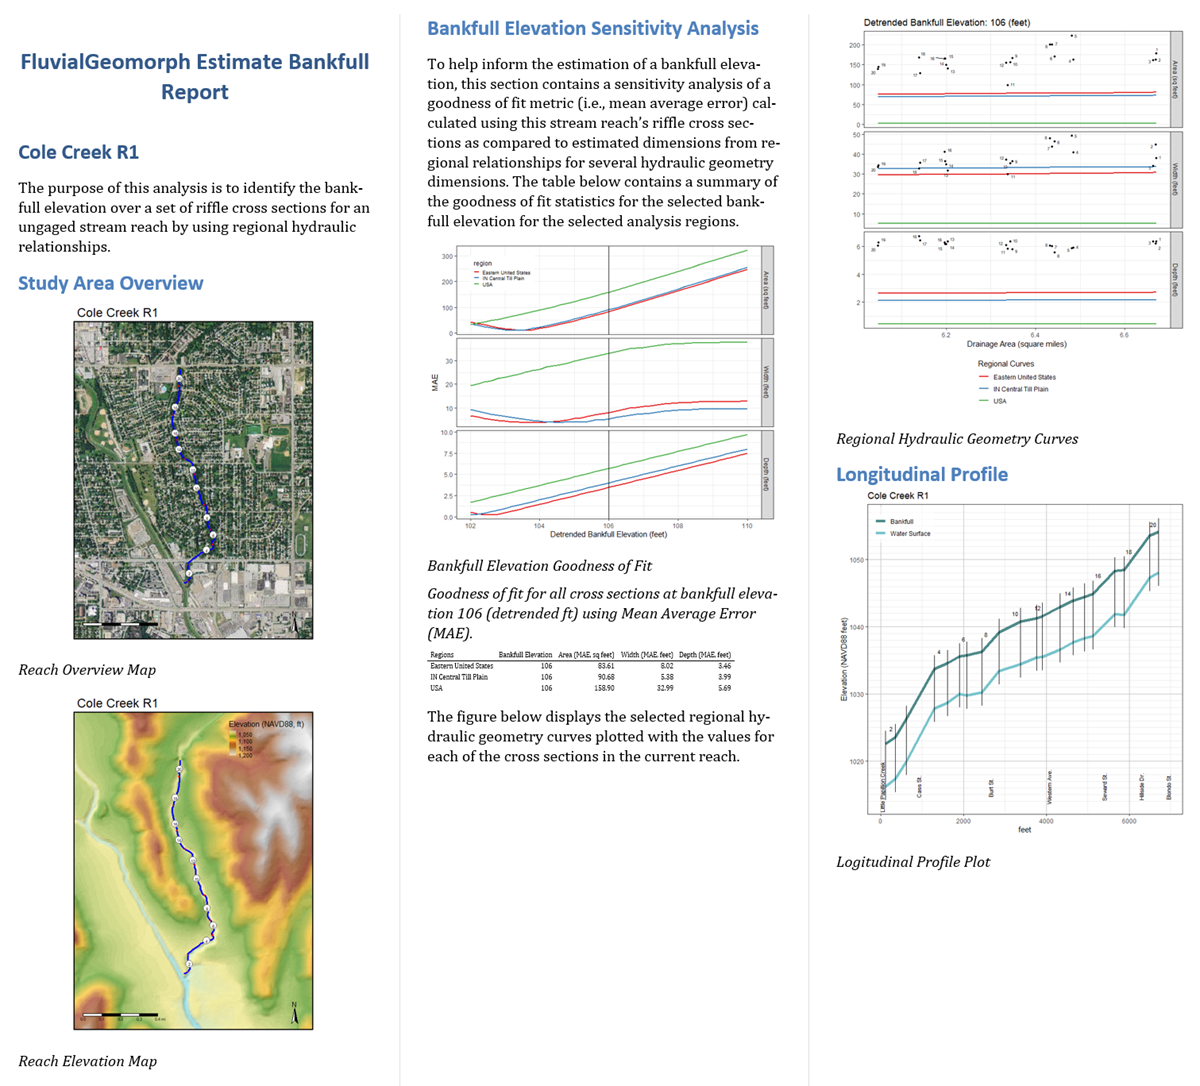
Figure 4.33: Level 2, Estimate Bankfull Report.
4.5.4 Report - L2
Purpose - The Level 2 Report contains a set of maps and graphs that describe the Level 2 channel dimensions calculated at the specified bankfull elevation, estimated using the L2 Estimate Bankfull Report. This report is produced using the Report - L2 tool using these instructions from the user manual.
Code - This report is created by the R Markdown parameterized report in the R package fluvgeo/reports/level_2_report.Rmd.
This report contains the following sections:
- Study Area Overview - This section provides an overview of the study area reach.
- Reach Overview Map - A reach overview map displaying cross section locations over an aerial image and/or a medium resolution DEM with multi-direction shaded relief. This figure is produced by the R function
fluvgeo::map_reach_overview.
- Reach Overview Map - A reach overview map displaying cross section locations over an aerial image and/or a medium resolution DEM with multi-direction shaded relief. This figure is produced by the R function
- Longitudinal Profile - This section displays the elevation (y-axis) of the stream reach along its length (x-axis) beginning from the downstream end of the reach moving upstream (typically referred to as a longitudinal profile).
- XS Longitudinal Profile - This longitudinal profile graph is created using a Level 2 cross section dimensions feature class for the survey used to generate the bankfull estimate. This figure is produced by the R function
fluvgeo::xs_profile_plot.
- XS Longitudinal Profile - This longitudinal profile graph is created using a Level 2 cross section dimensions feature class for the survey used to generate the bankfull estimate. This figure is produced by the R function
- Cross Section Metrics - This section displays metrics for the Level 2 dimensions calculated for the regular cross sections of a stream reach.
- Cross Section Metrics Plot, Level 2 - This stream reach metrics graph displays the Level 2 metrics on a faceted graph. This figure is produced by the R function
fluvgeo::xs_metrics_plot_L2. - Width Depth Ratio Map - A reach overview map is used to display the width depth ratio values at each cross section for the reach. The width depth ratio parameters (i.e., metric definition, class break values and labels) are defined in this report using the R S4 class
FluvialGeomorphicMetric. This figure is produced by the R functionfluvgeo::map_reach_metric. - Width Depth Ratio Graph - This graph displays the width depth ratio values (y-axis) of the stream along its length (x-axis) beginning from the downstream end of the reach moving upstream longitudinally. This graph uses the metric class definition for width depth ratio defined for the previous figure. This figure is produced by the R function
fluvgeo::xs_metric_plot. - Regional Hydraulic Geometry Curves Graph - This graph displays the channel dimensions of each cross section in the reach, along with the regional curve estimated dimensions. This figure is produced by the R function
fluvgeo::reach_rhg_graph.
- Cross Section Metrics Plot, Level 2 - This stream reach metrics graph displays the Level 2 metrics on a faceted graph. This figure is produced by the R function
- Cross Section Profiles - This section displays a focused view of the characteristics of each individual cross section in the stream reach.
- Cross Section Map - This map displays the extent of a single cross section in plan view with a high resolution DEM background. This figure is produced by the R function
fluvgeo::map_xs. - Regular XS Profile Compare Plot - This graph displays a single
*_L2_dimsfeature in a wide aspect ratio profile view to compare the elevations from multiple surveys if provided. This figure is produced by the R functionfluvgeo::xs_compare_plot_L2. - Bankfull Elevation Dimensions by Region Table - This table summarizes this cross section’s dimensions compared to several other regions at the current bankfull elevation. This table is created by code in the L2 Report,
fluvgeo/reports/level_2_report.Rmd.
- Cross Section Map - This map displays the extent of a single cross section in plan view with a high resolution DEM background. This figure is produced by the R function
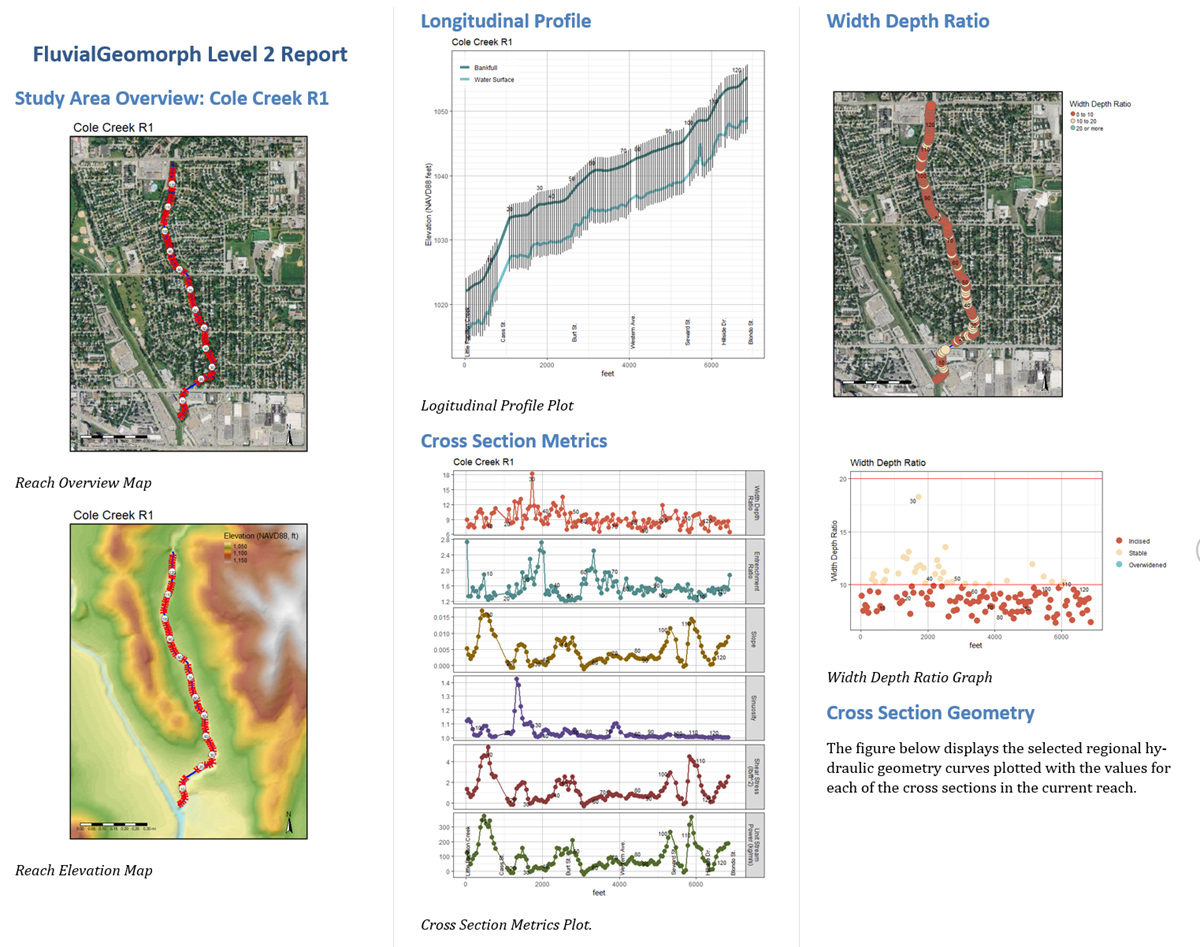
Figure 4.34: Level 2 Report.
4.5.5 Report - L3
Purpose - The Level 3 Report contains a set of maps and graphs that describe the Level 3 channel dimensions calculated at the specified bankfull elevation, estimated using the L2 Estimate Bankfull Report. This report is produced using the Report - L3 tool using these instructions from the user manual.
Code - This report is created by the R Markdown parameterized report in the R package fluvgeo/reports/level_3_report.Rmd.
This report contains the following sections:
- Study Area Overview - This section provides an overview of the study area reach.
- Reach Overview Map - A reach overview map displaying cross section locations over an aerial image and/or a medium resolution DEM with multi-direction shaded relief. This figure is produced by the R function
fluvgeo::map_reach_overview.
- Reach Overview Map - A reach overview map displaying cross section locations over an aerial image and/or a medium resolution DEM with multi-direction shaded relief. This figure is produced by the R function
- Longitudinal Profile - This section displays the elevation (y-axis) of the stream reach along its length (x-axis) beginning from the downstream end of the reach moving upstream (typically referred to as a longitudinal profile).
- XS Longitudinal Profile - This longitudinal profile graph is created using a Level 3 cross section dimensions feature class for the survey used to generate the bankfull estimate. This figure is produced by the R function
fluvgeo::xs_profile_plot.
- XS Longitudinal Profile - This longitudinal profile graph is created using a Level 3 cross section dimensions feature class for the survey used to generate the bankfull estimate. This figure is produced by the R function
- Cross Section Metrics - This section displays metrics for the Level 3 dimensions calculated for the regular cross sections of a stream reach.
- Cross Section Metrics Plot, Level 3 - This stream reach metrics graph displays the Level 3 metrics on a faceted graph. This figure is produced by the R function
fluvgeo::xs_metrics_plot_L3. - Width Depth Ratio Map - A reach overview map is used to display the width depth ratio values at each cross section for the reach. The width depth ratio parameters (i.e., metric definition, class break values and labels) are defined in this report using the R S4 class
FluvialGeomorphicMetric. This figure is produced by the R functionfluvgeo::map_reach_metric. - Width Depth Ratio Graph - This graph displays the width depth ratio values (y-axis) of the stream along its length (x-axis) beginning from the downstream end of the reach moving upstream longitudinally. This graph uses the metric class definition for width depth ratio defined for the previous figure. This figure is produced by the R function
fluvgeo::xs_metric_plot. - Radius of Curvature to Bankfull Width Map - A reach overview map is used to display the radius of curvature to bankfull width ratio values at each cross section for the reach. The radius of curvature to bankfull width ratio parameters (i.e., metric definition, class break values and labels) are defined in this report using the R S4 class
FluvialGeomorphicMetric. This figure is produced by the R functionfluvgeo::map_reach_metric. - Radius of Curvature to Bankfull Width Graph - This graph displays the radius of curvature to bankfull width ratio values (y-axis) of the stream along its length (x-axis) beginning from the downstream end of the reach moving upstream longitudinally. This graph uses the metric class definition for radius of curvature to bankfull width ratio defined for the previous figure. This figure is produced by the R function
fluvgeo::xs_metric_plot. - Regional Hydraulic Geometry Curves Graph - This graph displays the channel dimensions of each cross section in the reach, along with the regional curve estimated dimensions. This figure is produced by the R function
fluvgeo::reach_rhg_graph.
- Cross Section Metrics Plot, Level 3 - This stream reach metrics graph displays the Level 3 metrics on a faceted graph. This figure is produced by the R function
- Cross Section Profiles - This section displays a focused view of the characteristics of each individual cross section in the stream reach.
- Cross Section Map - This map displays the extent of a single cross section in plan view with a high resolution DEM background. This figure is produced by the R function
fluvgeo::map_xs. - Regular XS Profile Compare Plot - This graph displays a single
*_L3_dimsfeature in a wide aspect ratio profile view to compare the elevations from multiple surveys if provided. This figure is produced by the R functionfluvgeo::xs_compare_plot_L2. - Bankfull Elevation Dimensions by Region Table - This table summarizes this cross section’s dimensions compared to several other regions at the current bankfull elevation. This table is created by code in the L3 Report,
fluvgeo/reports/level_3_report.Rmd.
- Cross Section Map - This map displays the extent of a single cross section in plan view with a high resolution DEM background. This figure is produced by the R function
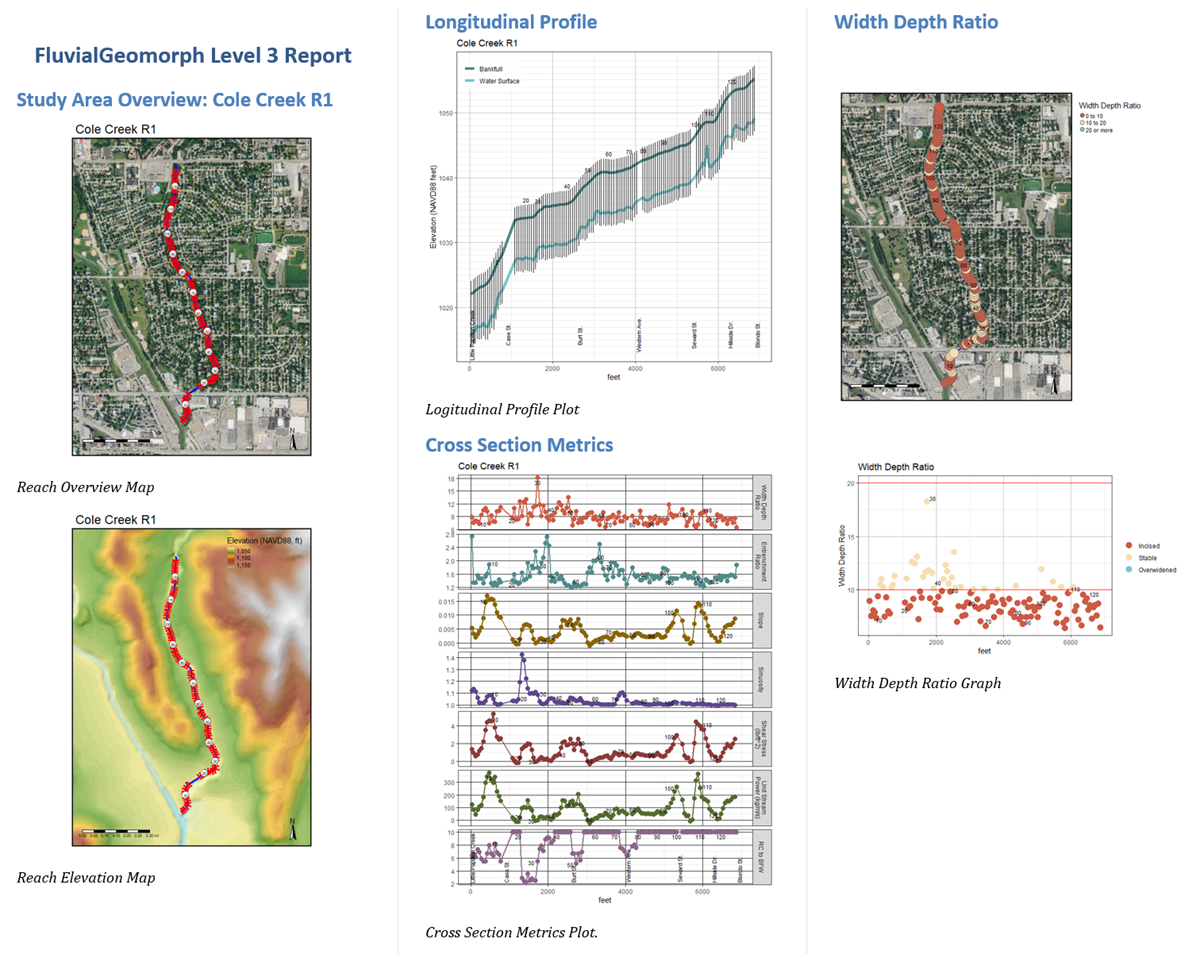
Figure 4.35: Level 3 Report.